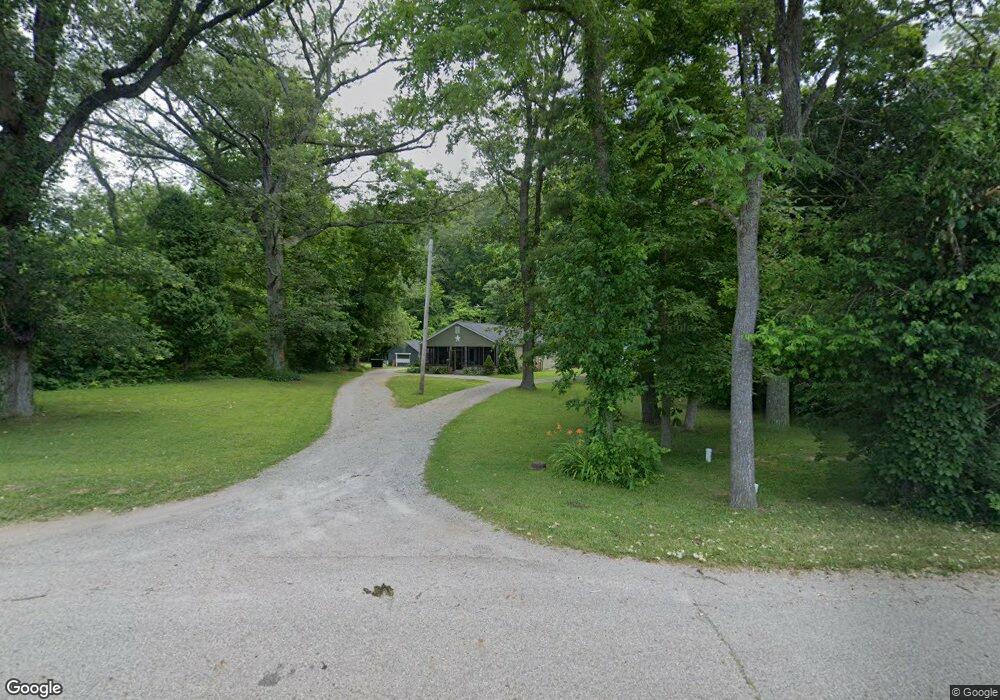
1122 Dry Run Rd Chillicothe, OH 45601
Estimated Value: $150,000 - $207,000
3
Beds
1
Bath
1,020
Sq Ft
$170/Sq Ft
Est. Value
About This Home
This home is located at 1122 Dry Run Rd, Chillicothe, OH 45601 and is currently estimated at $173,711, approximately $170 per square foot. 1122 Dry Run Rd is a home located in Ross County with nearby schools including Zane Trace Elementary School, Zane Trace Middle School, and Zane Trace High School.
Ownership History
Date
Name
Owned For
Owner Type
Purchase Details
Closed on
Sep 23, 2011
Sold by
Vance Brandon Kyle
Bought by
Delong Heidi
Current Estimated Value
Home Financials for this Owner
Home Financials are based on the most recent Mortgage that was taken out on this home.
Original Mortgage
$86,743
Outstanding Balance
$59,571
Interest Rate
4.32%
Mortgage Type
FHA
Estimated Equity
$114,140
Purchase Details
Closed on
Oct 4, 2007
Sold by
Bank Of New York
Bought by
Vance Brandon Kyle
Home Financials for this Owner
Home Financials are based on the most recent Mortgage that was taken out on this home.
Original Mortgage
$67,500
Interest Rate
6.33%
Mortgage Type
Purchase Money Mortgage
Purchase Details
Closed on
Apr 4, 2007
Sold by
Holt Floyd and Holt Floyd W
Bought by
Bank Of New York
Create a Home Valuation Report for This Property
The Home Valuation Report is an in-depth analysis detailing your home's value as well as a comparison with similar homes in the area
Home Values in the Area
Average Home Value in this Area
Purchase History
| Date | Buyer | Sale Price | Title Company |
|---|---|---|---|
| Delong Heidi | $89,000 | Arrow Title Agency | |
| Vance Brandon Kyle | $67,500 | Resource Title Of Cincinnati | |
| Bank Of New York | $30,000 | Resource Title Of Cincinnati |
Source: Public Records
Mortgage History
| Date | Status | Borrower | Loan Amount |
|---|---|---|---|
| Open | Delong Heidi | $86,743 | |
| Previous Owner | Vance Brandon Kyle | $67,500 |
Source: Public Records
Tax History Compared to Growth
Tax History
| Year | Tax Paid | Tax Assessment Tax Assessment Total Assessment is a certain percentage of the fair market value that is determined by local assessors to be the total taxable value of land and additions on the property. | Land | Improvement |
|---|---|---|---|---|
| 2024 | $694 | $20,710 | $3,740 | $16,970 |
| 2023 | $694 | $20,710 | $3,740 | $16,970 |
| 2022 | $709 | $20,710 | $3,740 | $16,970 |
| 2021 | $792 | $21,640 | $4,200 | $17,440 |
| 2020 | $792 | $21,640 | $4,200 | $17,440 |
| 2019 | $793 | $21,640 | $4,200 | $17,440 |
| 2018 | $753 | $19,730 | $4,190 | $15,540 |
| 2017 | $770 | $19,730 | $4,190 | $15,540 |
| 2016 | $750 | $19,730 | $4,190 | $15,540 |
| 2015 | $686 | $18,020 | $4,190 | $13,830 |
| 2014 | $669 | $18,020 | $4,190 | $13,830 |
| 2013 | $672 | $18,020 | $4,190 | $13,830 |
Source: Public Records
Map
Nearby Homes
- 149 Brown Hollow Rd
- 3661 Lick Run Rd
- 2998 Dry Run Rd
- 3040 Seney Rd Unit 912
- 108 Lane Dr
- 822 Chapel Creek Rd
- 1959 Chapel Creek Rd
- 965 Graves Rd
- 1046 Dayton St
- 1014 Dayton St
- 945 Columbus St
- 905 Akron St
- 923 Jefferson Ave
- 831 Jefferson Ave
- 0 U S 23
- 20702 U S 23
- 778 Madison Ave
- 794 Jefferson Ave
- 783 Adams Ave
- 623 Glencroft Ave
- 1090 Dry Run Rd
- 1016 Dry Run Rd
- 918 Dry Run Rd
- 922 Dry Run Rd
- 1383 Dry Run Rd
- 1261 E Hydell Rd
- 883 E Hydell Rd
- 1297 E Hydell Rd
- 212 Brown Hollow Rd
- 210 Brown Hollow Rd
- 175 Brown Hollow Rd
- 283 Brown Hollow Rd
- 55 Brown Hollow Rd
- 809 Walnut Creek Rd
- 28 Brown Hollow Rd
- 111 Brown Hollow Rd
- 775 Walnut Creek Rd
- 29 Brown Hollow Rd
- 879 Walnut Creek Rd
- 355 Brown Hollow Rd