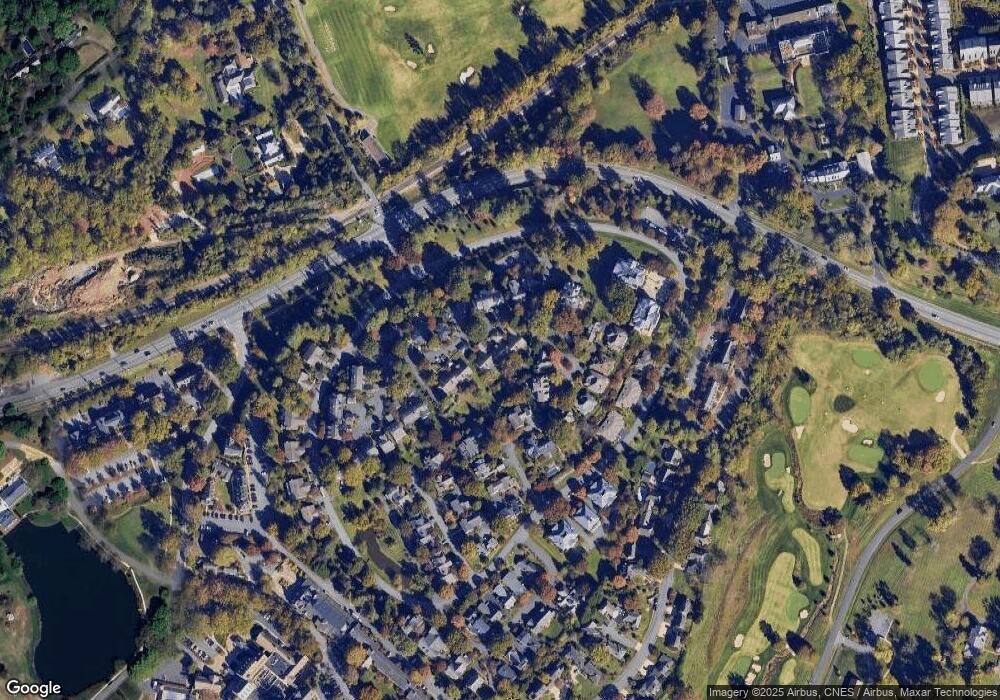
1122 Dryden Ln Charlottesville, VA 22903
Estimated Value: $1,294,208 - $1,536,000
3
Beds
3
Baths
3,252
Sq Ft
$425/Sq Ft
Est. Value
About This Home
This home is located at 1122 Dryden Ln, Charlottesville, VA 22903 and is currently estimated at $1,383,552, approximately $425 per square foot. 1122 Dryden Ln is a home located in Albemarle County with nearby schools including Virginia L. Murray Elementary School, Joseph T. Henley Middle School, and Western Albemarle High School.
Ownership History
Date
Name
Owned For
Owner Type
Purchase Details
Closed on
Dec 14, 2020
Sold by
The Trust Company Of Virginia
Bought by
Castleman William R and Castleman Johannah Lyons
Current Estimated Value
Home Financials for this Owner
Home Financials are based on the most recent Mortgage that was taken out on this home.
Original Mortgage
$668,000
Outstanding Balance
$595,780
Interest Rate
2.8%
Mortgage Type
New Conventional
Estimated Equity
$787,772
Create a Home Valuation Report for This Property
The Home Valuation Report is an in-depth analysis detailing your home's value as well as a comparison with similar homes in the area
Home Values in the Area
Average Home Value in this Area
Purchase History
| Date | Buyer | Sale Price | Title Company |
|---|---|---|---|
| Castleman William R | $835,000 | Old Republic Natl Ttl Ins Co |
Source: Public Records
Mortgage History
| Date | Status | Borrower | Loan Amount |
|---|---|---|---|
| Open | Castleman William R | $668,000 |
Source: Public Records
Tax History Compared to Growth
Tax History
| Year | Tax Paid | Tax Assessment Tax Assessment Total Assessment is a certain percentage of the fair market value that is determined by local assessors to be the total taxable value of land and additions on the property. | Land | Improvement |
|---|---|---|---|---|
| 2025 | $10,352 | $1,157,900 | $285,300 | $872,600 |
| 2024 | -- | $1,078,100 | $243,000 | $835,100 |
| 2023 | $9,463 | $1,108,100 | $234,000 | $874,100 |
| 2022 | $7,694 | $900,900 | $224,600 | $676,300 |
| 2021 | $7,127 | $834,500 | $216,000 | $618,500 |
| 2020 | $7,824 | $916,200 | $216,000 | $700,200 |
| 2019 | $7,341 | $859,600 | $216,000 | $643,600 |
| 2018 | $7,144 | $822,300 | $198,000 | $624,300 |
| 2017 | $7,388 | $880,600 | $198,000 | $682,600 |
| 2016 | $6,348 | $756,600 | $198,000 | $558,600 |
| 2015 | $5,661 | $691,200 | $157,500 | $533,700 |
| 2014 | -- | $683,800 | $157,500 | $526,300 |
Source: Public Records
Map
Nearby Homes