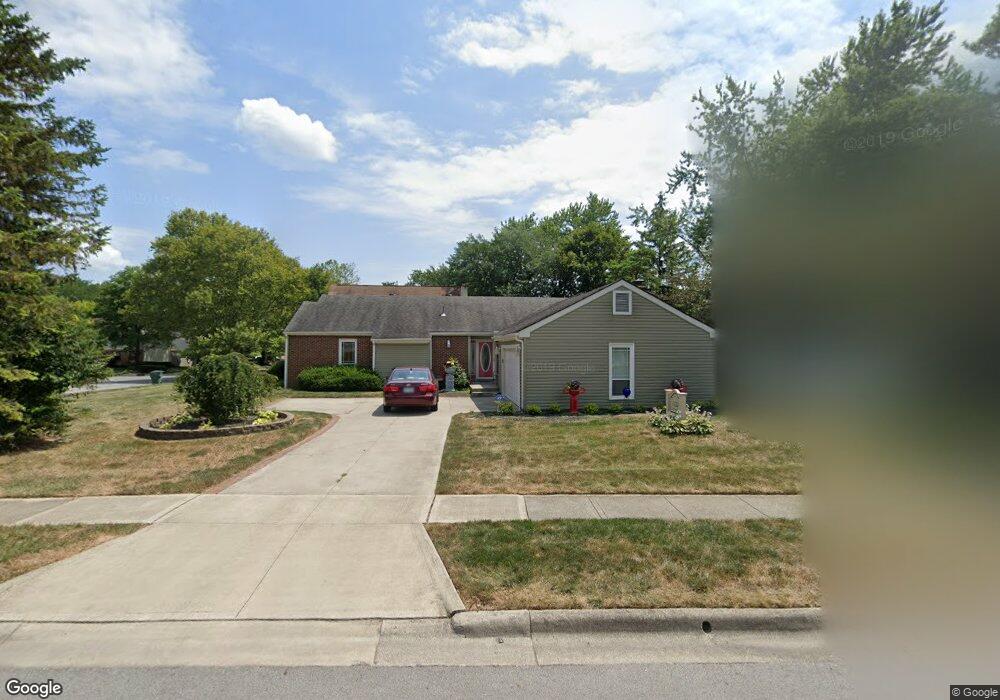
1122 Firth Ave Unit TWENTY Columbus, OH 43085
Devon Triangle NeighborhoodEstimated Value: $114,000 - $142,000
3
Beds
1
Bath
979
Sq Ft
$131/Sq Ft
Est. Value
About This Home
This home is located at 1122 Firth Ave Unit TWENTY, Columbus, OH 43085 and is currently estimated at $128,000, approximately $130 per square foot. 1122 Firth Ave Unit TWENTY is a home located in Franklin County with nearby schools including Windsor Stem Acadmey, Linden-Mckinley Stem School On Arcadia, and Columbus Performance Academy.
Ownership History
Date
Name
Owned For
Owner Type
Purchase Details
Closed on
Sep 15, 2022
Sold by
Queens Multiservices Llc
Bought by
Dynasty Realty Group Llc
Current Estimated Value
Purchase Details
Closed on
Sep 19, 2019
Sold by
Hawkins Deborah J
Bought by
Queens Multi Services Llc
Home Financials for this Owner
Home Financials are based on the most recent Mortgage that was taken out on this home.
Interest Rate
3.73%
Purchase Details
Closed on
Mar 26, 2001
Sold by
Mid State Homes Inc
Bought by
Hawkins Deborah J
Home Financials for this Owner
Home Financials are based on the most recent Mortgage that was taken out on this home.
Original Mortgage
$57,545
Interest Rate
7.02%
Mortgage Type
FHA
Purchase Details
Closed on
Mar 13, 2000
Sold by
Vasser Sharon D
Bought by
Mid State Homes Inc
Purchase Details
Closed on
Nov 27, 1979
Bought by
Smith Agnes L
Create a Home Valuation Report for This Property
The Home Valuation Report is an in-depth analysis detailing your home's value as well as a comparison with similar homes in the area
Home Values in the Area
Average Home Value in this Area
Purchase History
| Date | Buyer | Sale Price | Title Company |
|---|---|---|---|
| Dynasty Realty Group Llc | $1,500 | Landsel Title Agency | |
| Queens Multi Services Llc | $6,200 | -- | |
| Hawkins Deborah J | $58,000 | Ohio Title Agency | |
| Mid State Homes Inc | $24,000 | -- | |
| Smith Agnes L | -- | -- |
Source: Public Records
Mortgage History
| Date | Status | Borrower | Loan Amount |
|---|---|---|---|
| Previous Owner | Queens Multi Services Llc | -- | |
| Previous Owner | Hawkins Deborah J | $57,545 |
Source: Public Records
Tax History Compared to Growth
Tax History
| Year | Tax Paid | Tax Assessment Tax Assessment Total Assessment is a certain percentage of the fair market value that is determined by local assessors to be the total taxable value of land and additions on the property. | Land | Improvement |
|---|---|---|---|---|
| 2024 | $1,183 | $5,290 | $5,290 | -- |
| 2023 | $255 | $5,290 | $5,290 | -- |
| 2022 | $328 | $2,590 | $2,590 | $0 |
| 2021 | $181 | $2,590 | $2,590 | $0 |
| 2020 | $167 | $2,590 | $2,590 | $0 |
| 2019 | $135 | $2,170 | $2,170 | $0 |
| 2018 | $112 | $2,170 | $2,170 | $0 |
| 2017 | $116 | $2,170 | $2,170 | $0 |
| 2016 | $98 | $1,440 | $1,440 | $0 |
| 2015 | $89 | $1,440 | $1,440 | $0 |
| 2014 | $89 | $1,440 | $1,440 | $0 |
| 2013 | $374 | $12,215 | $3,220 | $8,995 |
Source: Public Records
Map
Nearby Homes
- 1463 Gibbard Ave
- 0 Leona Ave
- 841 Saint Clair Ave
- 940 Shoemaker Ave
- 1082-1084 Peters Ave
- 883 Mansfield Ave
- 1186 Saint Clair Ave
- 997-999 Gibbard Ave
- 810-812 E 3rd Ave
- 940-942 Leona Ave
- 570 N Ohio Ave
- 800-802 E Starr Ave
- 796 Gibbard Ave
- 560 N Ohio Ave
- 790-792 E Starr Ave
- 542-544 Trevitt St
- 780-782 Gibbard Ave
- 779 Gibbard Ave
- 927 Camden Ave
- 773-775 E 3rd Ave
- 1118 Firth Ave Unit TWENTY
- 1128 Firth Ave Unit TWENTY
- 1106 Firth Ave Unit TWENTY
- 1125 Firth Ave Unit TWENTY
- 1117 Firth Ave Unit TWENTY
- 1129 Firth Ave Unit TWENTY
- 1113 Firth Ave Unit TWENTY
- 1109 Firth Ave Unit TWENTY
- 1103 Firth Ave Unit TWENTY
- 873 N 20th St
- 1195 E 5th Ave Unit REAR
- 1199 E 5th Ave
- 1424 Gibbard Ave
- 865 N 20th St
- 873 N 19th St
- 1205 E 5th Ave
- 876 N 20th St
- 1608 Gibbard Ave
- 1474 Gibbard Ave
- 1133 Gibbard Ave