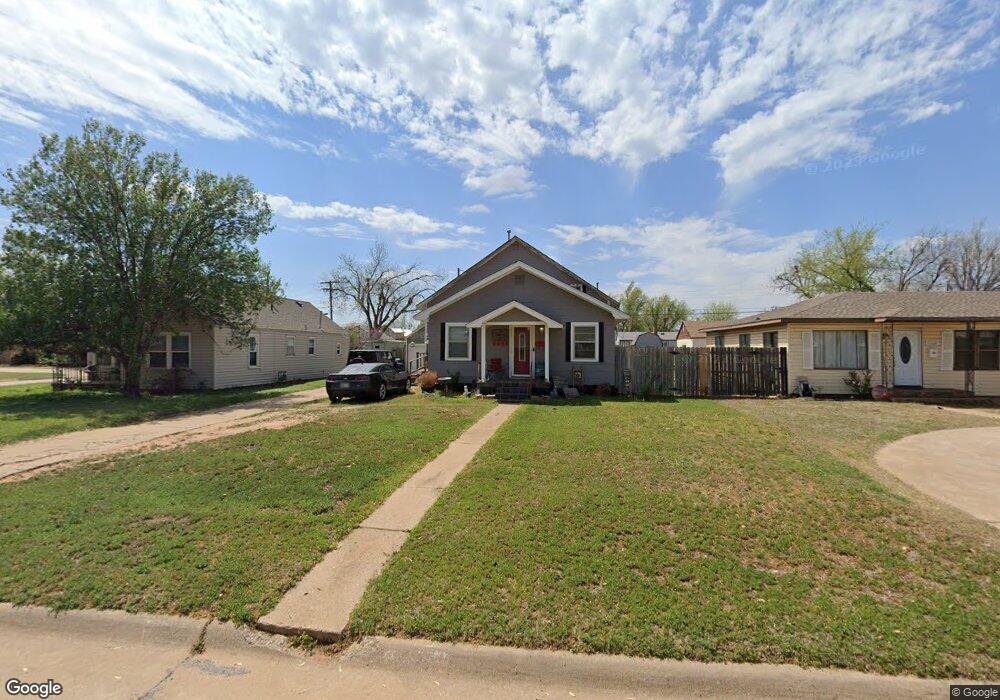
1122 S 8th St Kingfisher, OK 73750
Estimated Value: $182,000 - $197,000
4
Beds
2
Baths
2,096
Sq Ft
$92/Sq Ft
Est. Value
About This Home
This home is located at 1122 S 8th St, Kingfisher, OK 73750 and is currently estimated at $192,576, approximately $91 per square foot. 1122 S 8th St is a home located in Kingfisher County with nearby schools including Gilmour Elementary School, Kingfisher Middle School, and Kingfisher High School.
Ownership History
Date
Name
Owned For
Owner Type
Purchase Details
Closed on
Jul 23, 2021
Sold by
Lung Charles
Bought by
Jones Dotti Lynn and Lung Dotti
Current Estimated Value
Purchase Details
Closed on
Jul 9, 2014
Sold by
Reherman Jeremy Ryan
Bought by
Jones Dotti
Purchase Details
Closed on
Aug 13, 2008
Sold by
Ince Tim and Ince Brandi M
Bought by
Jones Dotti
Home Financials for this Owner
Home Financials are based on the most recent Mortgage that was taken out on this home.
Original Mortgage
$95,968
Interest Rate
6.38%
Mortgage Type
FHA
Purchase Details
Closed on
May 5, 2005
Sold by
Ince Tim and Ince Brandi M
Bought by
Ince Tim and Ince Brandi M
Purchase Details
Closed on
Jul 17, 1998
Sold by
Roger A Arthurs
Bought by
Brandi M Hall
Purchase Details
Closed on
Nov 10, 1994
Sold by
Roger A Arthurs
Bought by
Zachary Arthurs
Create a Home Valuation Report for This Property
The Home Valuation Report is an in-depth analysis detailing your home's value as well as a comparison with similar homes in the area
Home Values in the Area
Average Home Value in this Area
Purchase History
| Date | Buyer | Sale Price | Title Company |
|---|---|---|---|
| Jones Dotti Lynn | -- | None Available | |
| Jones Dotti | -- | None Available | |
| Jones Dotti | $104,500 | None Available | |
| Ince Tim | -- | None Available | |
| Brandi M Hall | $30,300 | -- | |
| Zachary Arthurs | $9,600 | -- |
Source: Public Records
Mortgage History
| Date | Status | Borrower | Loan Amount |
|---|---|---|---|
| Previous Owner | Jones Dotti | $95,968 |
Source: Public Records
Tax History
| Year | Tax Paid | Tax Assessment Tax Assessment Total Assessment is a certain percentage of the fair market value that is determined by local assessors to be the total taxable value of land and additions on the property. | Land | Improvement |
|---|---|---|---|---|
| 2025 | $1,167 | $11,824 | $528 | $11,296 |
| 2024 | $913 | $11,260 | $503 | $10,757 |
| 2023 | $913 | $10,724 | $341 | $10,383 |
| 2022 | $844 | $10,724 | $341 | $10,383 |
| 2021 | $850 | $10,724 | $341 | $10,383 |
| 2020 | $847 | $10,724 | $341 | $10,383 |
| 2019 | $834 | $10,946 | $341 | $10,605 |
| 2018 | $806 | $10,627 | $341 | $10,286 |
| 2017 | $847 | $10,612 | $341 | $10,271 |
| 2016 | $855 | $10,744 | $341 | $10,403 |
| 2015 | $1,063 | $12,070 | $127 | $11,943 |
| 2014 | $1,039 | $11,495 | $1,375 | $10,120 |
Source: Public Records
Map
Nearby Homes
- 1124 S 8th St
- 1108 S 8th St
- 1106 S 8th St
- 1216 Ridgecrest Dr
- 1109 S 9th St
- 1111 S 9th St
- 1107 S 9th St
- 1102 S 8th St
- 1125 S 8th St
- 1215 Ridgecrest Dr
- 1113 S 8th St
- 1100 S 8th St
- 1101 S 9th St
- 1109 S 8th St
- 315 W Overstreet Ave
- 1218 Ridgecrest Dr
- 1025 S 9th St
- 1024 S 8th St
- 1103 S 8th St
- 1203 Regency Ct
Your Personal Tour Guide
Ask me questions while you tour the home.