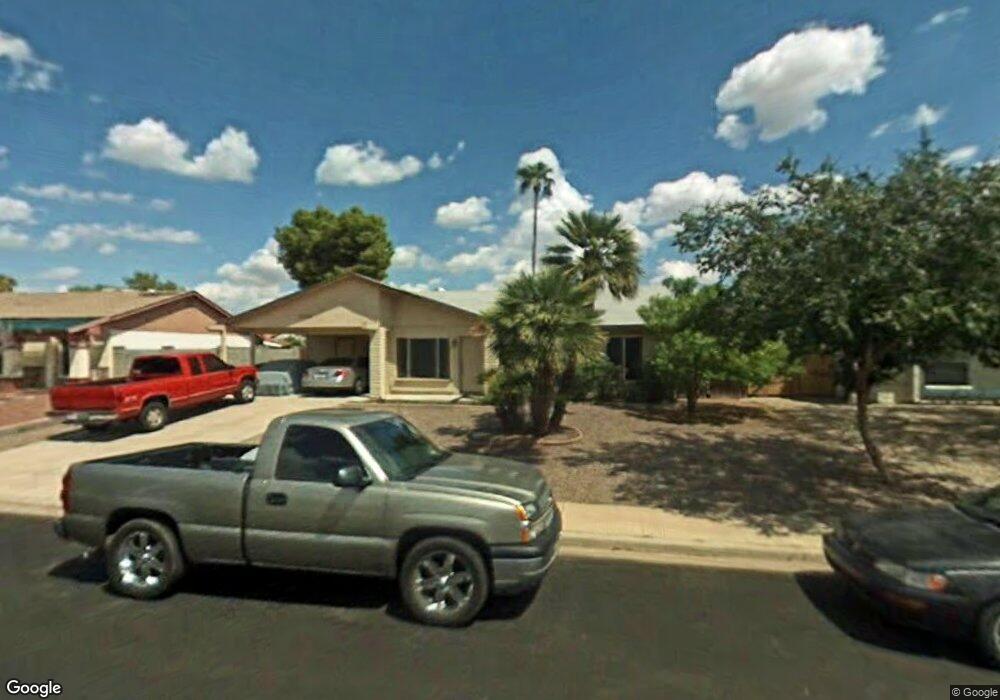
1122 W Laguna Azul Ave Mesa, AZ 85210
Dobson NeighborhoodEstimated Value: $361,283 - $484,000
3
Beds
2
Baths
1,449
Sq Ft
$292/Sq Ft
Est. Value
About This Home
This home is located at 1122 W Laguna Azul Ave, Mesa, AZ 85210 and is currently estimated at $423,071, approximately $291 per square foot. 1122 W Laguna Azul Ave is a home located in Maricopa County with nearby schools including Crismon Elementary School, Franklin at Brimhall Elementary School, and Franklin Accelerated Academy Jordan Campus.
Ownership History
Date
Name
Owned For
Owner Type
Purchase Details
Closed on
Jul 24, 2004
Sold by
Potter Gregory S
Bought by
Thro Jourdain
Current Estimated Value
Home Financials for this Owner
Home Financials are based on the most recent Mortgage that was taken out on this home.
Original Mortgage
$123,900
Outstanding Balance
$62,182
Interest Rate
6.29%
Mortgage Type
New Conventional
Estimated Equity
$360,889
Purchase Details
Closed on
Apr 7, 2000
Sold by
Levy Maurice L
Bought by
Potter Gregory S
Home Financials for this Owner
Home Financials are based on the most recent Mortgage that was taken out on this home.
Original Mortgage
$86,996
Interest Rate
8.24%
Mortgage Type
FHA
Create a Home Valuation Report for This Property
The Home Valuation Report is an in-depth analysis detailing your home's value as well as a comparison with similar homes in the area
Home Values in the Area
Average Home Value in this Area
Purchase History
| Date | Buyer | Sale Price | Title Company |
|---|---|---|---|
| Thro Jourdain | $154,900 | Chicago Title Insurance Co | |
| Potter Gregory S | $111,800 | First American Title |
Source: Public Records
Mortgage History
| Date | Status | Borrower | Loan Amount |
|---|---|---|---|
| Open | Thro Jourdain | $123,900 | |
| Previous Owner | Potter Gregory S | $86,996 | |
| Closed | Thro Jourdain | $30,900 |
Source: Public Records
Tax History Compared to Growth
Tax History
| Year | Tax Paid | Tax Assessment Tax Assessment Total Assessment is a certain percentage of the fair market value that is determined by local assessors to be the total taxable value of land and additions on the property. | Land | Improvement |
|---|---|---|---|---|
| 2025 | $1,320 | $15,898 | -- | -- |
| 2024 | $1,335 | $15,141 | -- | -- |
| 2023 | $1,335 | $32,630 | $6,520 | $26,110 |
| 2022 | $1,305 | $24,260 | $4,850 | $19,410 |
| 2021 | $1,341 | $22,360 | $4,470 | $17,890 |
| 2020 | $1,323 | $21,150 | $4,230 | $16,920 |
| 2019 | $1,226 | $18,420 | $3,680 | $14,740 |
| 2018 | $1,170 | $16,860 | $3,370 | $13,490 |
| 2017 | $1,134 | $15,770 | $3,150 | $12,620 |
| 2016 | $1,113 | $15,180 | $3,030 | $12,150 |
| 2015 | $1,051 | $13,760 | $2,750 | $11,010 |
Source: Public Records
Map
Nearby Homes
- 2156 S Emerson
- 1160 W Madero Cir
- 1338 W Lobo Ave
- 1005 W Madero Ave
- 906 W Kiowa Ave
- 1255 W Baseline Rd Unit B139
- 2522 S Spruce
- 1114 W Meseto Ave
- 1231 W Baseline Rd
- 1331 W Baseline Rd Unit 167
- 1331 W Baseline Rd Unit 251
- 1331 W Baseline Rd Unit 148
- 1331 W Baseline Rd Unit 171
- 1331 W Baseline Rd Unit 348
- 1331 W Baseline Rd Unit 272
- 1331 W Baseline Rd Unit 253
- 1331 W Baseline Rd Unit 102
- 1331 W Baseline Rd Unit 153
- 945 W Mendoza Ave
- 1358 W Lobo Ave
- 1116 W Laguna Azul Ave
- 1128 W Laguna Azul Ave
- 2228 S Spruce
- 2234 S Spruce
- 1110 W Laguna Azul Ave
- 2222 S Spruce
- 1121 W Laguna Azul Ave
- 1132 W Laguna Azul Ave
- 1129 W Laguna Azul Ave
- 2240 S Spruce
- 1115 W Laguna Azul Ave
- 1127 W Kilarea Ave
- 1104 W Laguna Azul Ave
- 1140 W Laguna Azul Ave
- 2246 S Spruce
- 1133 W Kilarea Ave
- 1143 W Laguna Azul Ave
- 1132 W Los Lagos Vista Cir
- 1046 W Kiowa Cir
- 1113 W Kilarea Ave