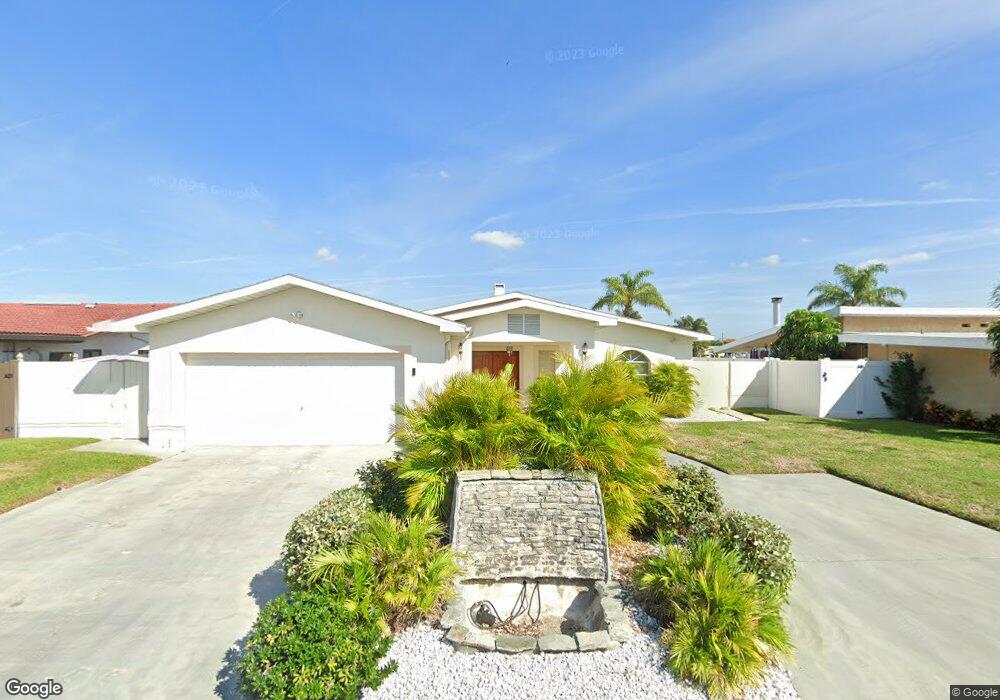
11225 5th St E Treasure Island, FL 33706
Estimated Value: $716,470 - $1,004,000
Studio
--
Bath
1,792
Sq Ft
$480/Sq Ft
Est. Value
About This Home
This home is located at 11225 5th St E, Treasure Island, FL 33706 and is currently estimated at $860,118, approximately $479 per square foot. 11225 5th St E is a home with nearby schools including Azalea Elementary School, Azalea Middle School, and Boca Ciega High School.
Ownership History
Date
Name
Owned For
Owner Type
Purchase Details
Closed on
May 10, 2007
Sold by
Fabusch Barbara Jurga
Bought by
Fabusch Peter and Fabusch Barbara Jurga
Current Estimated Value
Purchase Details
Closed on
Jun 30, 1993
Sold by
Zirbel Linda M
Bought by
Fabusch Barbara Jurga
Home Financials for this Owner
Home Financials are based on the most recent Mortgage that was taken out on this home.
Original Mortgage
$120,000
Interest Rate
7.48%
Create a Home Valuation Report for This Property
The Home Valuation Report is an in-depth analysis detailing your home's value as well as a comparison with similar homes in the area
Home Values in the Area
Average Home Value in this Area
Purchase History
| Date | Buyer | Sale Price | Title Company |
|---|---|---|---|
| Fabusch Peter | $45,000 | None Available | |
| Fabusch Barbara Jurga | -- | -- | |
| Fabusch Barbara Jurga | $152,000 | -- |
Source: Public Records
Mortgage History
| Date | Status | Borrower | Loan Amount |
|---|---|---|---|
| Previous Owner | Fabusch Barbara Jurga | $120,000 |
Source: Public Records
Tax History
| Year | Tax Paid | Tax Assessment Tax Assessment Total Assessment is a certain percentage of the fair market value that is determined by local assessors to be the total taxable value of land and additions on the property. | Land | Improvement |
|---|---|---|---|---|
| 2025 | $3,627 | $238,729 | -- | -- |
| 2024 | $3,569 | $271,597 | -- | -- |
| 2023 | $3,569 | $263,686 | $0 | $0 |
| 2022 | $3,467 | $256,006 | $0 | $0 |
| 2021 | $3,523 | $248,550 | $0 | $0 |
| 2020 | $3,484 | $245,118 | $0 | $0 |
| 2019 | $3,424 | $239,607 | $0 | $0 |
| 2018 | $3,349 | $235,139 | $0 | $0 |
| 2017 | $3,310 | $230,303 | $0 | $0 |
| 2016 | $3,370 | $225,566 | $0 | $0 |
| 2015 | $3,435 | $223,998 | $0 | $0 |
| 2014 | $3,418 | $222,220 | $0 | $0 |
Source: Public Records
Map
Nearby Homes
- 11185 5th St E
- 11305 5th St E
- 11325 5th St E
- 11340 5th St E
- 11320 6th St E
- 11100 5th St E
- 11105 5th St E
- 11145 4th St E
- 11050 5th St E
- 11425 5th St E
- 11405 6th St E
- 605 115th Ave
- 635 115th Ave
- 510 115th Ave
- 11055 6th St E
- 600 115th Ave
- 11460 7th St E
- 11365 7th St E
- 11045 3rd St E Unit 6
- 11465 7th St E
Your Personal Tour Guide
Ask me questions while you tour the home.