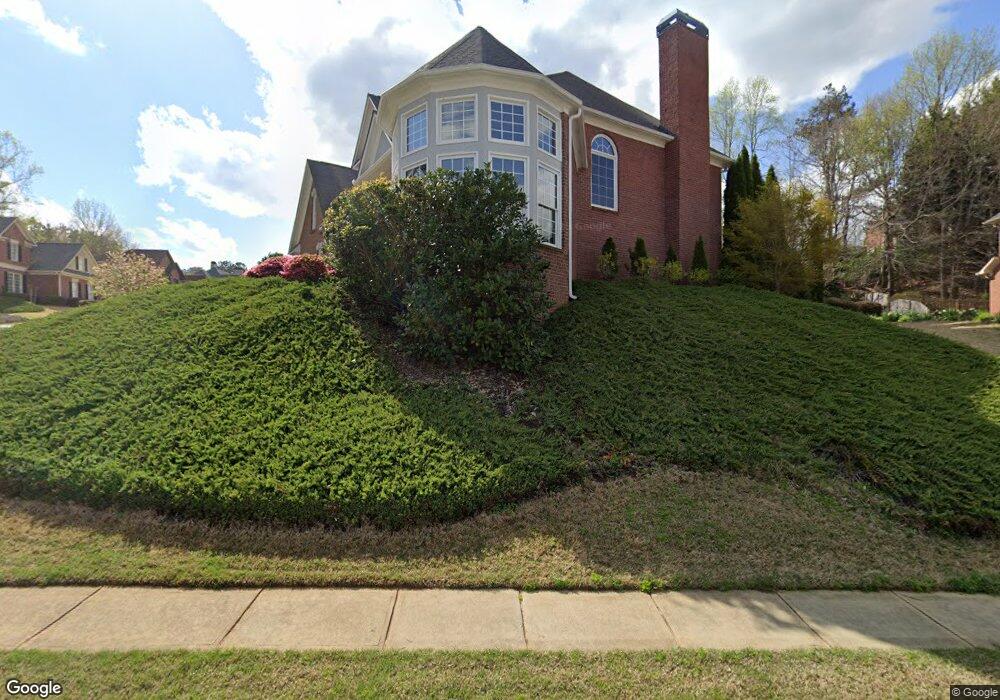
11225 Donnington Dr Duluth, GA 30097
Estimated Value: $789,398 - $869,000
5
Beds
3
Baths
3,396
Sq Ft
$248/Sq Ft
Est. Value
About This Home
This home is located at 11225 Donnington Dr, Duluth, GA 30097 and is currently estimated at $843,850, approximately $248 per square foot. 11225 Donnington Dr is a home located in Fulton County with nearby schools including Abbotts Hill Elementary School, Taylor Road Middle School, and Chattahoochee High School.
Ownership History
Date
Name
Owned For
Owner Type
Purchase Details
Closed on
Jul 30, 2002
Sold by
Mortgage Lenders Network Usa
Bought by
Rosenblum Craig A and Rosenblum Andrea F
Current Estimated Value
Home Financials for this Owner
Home Financials are based on the most recent Mortgage that was taken out on this home.
Original Mortgage
$280,250
Outstanding Balance
$118,418
Interest Rate
6.53%
Mortgage Type
New Conventional
Estimated Equity
$725,432
Purchase Details
Closed on
Feb 5, 2002
Sold by
Edwards Patricia A
Bought by
Mortgage Lenders Network Usa Inc
Purchase Details
Closed on
Feb 28, 2000
Sold by
Centex Homes
Bought by
Edwards Patricia A
Home Financials for this Owner
Home Financials are based on the most recent Mortgage that was taken out on this home.
Original Mortgage
$287,356
Interest Rate
8.37%
Mortgage Type
New Conventional
Create a Home Valuation Report for This Property
The Home Valuation Report is an in-depth analysis detailing your home's value as well as a comparison with similar homes in the area
Home Values in the Area
Average Home Value in this Area
Purchase History
| Date | Buyer | Sale Price | Title Company |
|---|---|---|---|
| Rosenblum Craig A | $295,000 | -- | |
| Mortgage Lenders Network Usa Inc | $309,690 | -- | |
| Edwards Patricia A | $319,400 | -- |
Source: Public Records
Mortgage History
| Date | Status | Borrower | Loan Amount |
|---|---|---|---|
| Open | Rosenblum Craig A | $280,250 | |
| Previous Owner | Edwards Patricia A | $287,356 |
Source: Public Records
Tax History Compared to Growth
Tax History
| Year | Tax Paid | Tax Assessment Tax Assessment Total Assessment is a certain percentage of the fair market value that is determined by local assessors to be the total taxable value of land and additions on the property. | Land | Improvement |
|---|---|---|---|---|
| 2025 | $5,604 | $257,120 | $61,800 | $195,320 |
| 2023 | $7,370 | $261,120 | $61,800 | $199,320 |
| 2022 | $5,370 | $201,120 | $45,680 | $155,440 |
| 2021 | $5,330 | $195,200 | $44,320 | $150,880 |
| 2020 | $5,276 | $185,080 | $42,040 | $143,040 |
| 2019 | $676 | $185,080 | $42,040 | $143,040 |
| 2018 | $4,638 | $185,080 | $42,040 | $143,040 |
| 2017 | $5,309 | $177,960 | $40,400 | $137,560 |
| 2016 | $5,197 | $177,960 | $40,400 | $137,560 |
| 2015 | $5,255 | $177,960 | $40,400 | $137,560 |
| 2014 | $4,421 | $138,400 | $34,400 | $104,000 |
Source: Public Records
Map
Nearby Homes
- 11260 Donnington Dr
- 130 Wyndlam Ct
- 775 Ellsborough Ct
- 5680 Abbotts Bridge Rd
- 5690 Abbotts Bridge Rd
- 1660 Gladewood Dr
- 11235 Surrey Park Trail
- 640 Arncliffe Ct Unit 1
- 5610 N Hillbrooke Trace
- 11615 Windbrooke Way
- 6365 Murets Rd
- 11420 Crossington Rd
- 335 Dunhill Way Ct
- 5325 Hillgate Crossing
- 5575 Ashwind Trace
- 5785 Oxborough Way Unit 1
- 0 Donnington Dr
- 11235 Donnington Dr
- 11415 Donnington Dr
- 11540 Donnington Dr
- 11245 Donnington Dr
- 11250 Donnington Dr
- 11240 Donnington Dr
- 11530 Donnington Dr
- 145 Wyndlam Ct
- 135 Wyndlam Ct
- 11230 Donnington Dr
- 11270 Donnington Dr
- 11255 Donnington Dr
- 11520 Donnington Dr
- 11395 Donnington Dr Unit II
- 11220 Donnington Dr
- 11280 Donnington Dr
- 140 Wyndlam Ct
- 11265 Donnington Dr
- 125 Wyndlam Ct