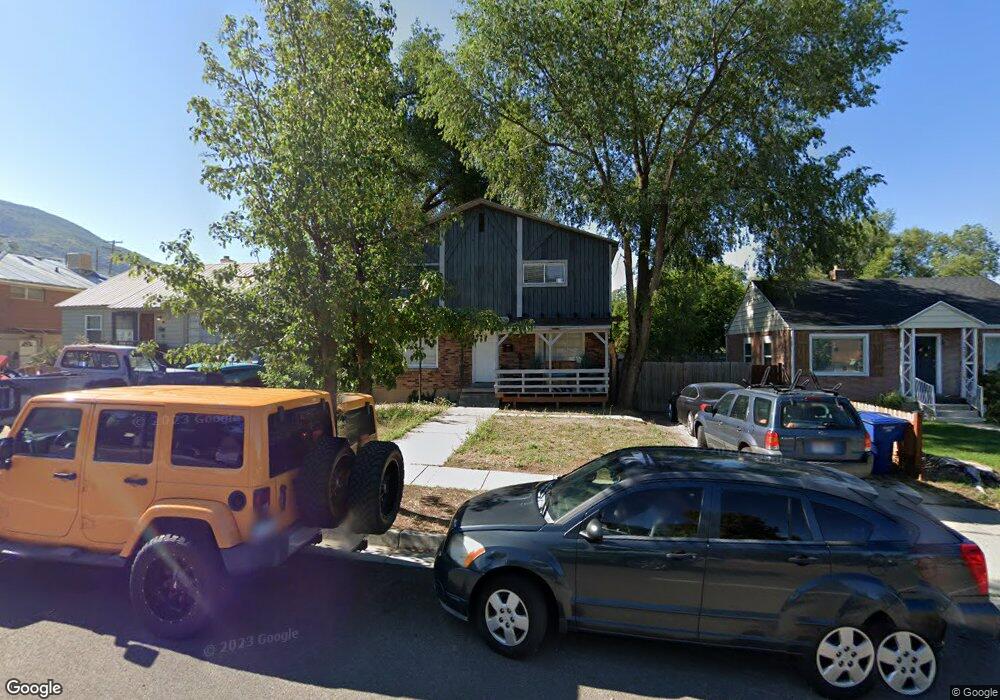
1123 30th St Ogden, UT 84403
TO Smith NeighborhoodEstimated Value: $425,585 - $488,000
5
Beds
2
Baths
2,653
Sq Ft
$168/Sq Ft
Est. Value
About This Home
This home is located at 1123 30th St, Ogden, UT 84403 and is currently estimated at $444,896, approximately $167 per square foot. 1123 30th St is a home located in Weber County with nearby schools including Wasatch Elementary School, Mount Ogden Junior High School, and Ogden High School.
Ownership History
Date
Name
Owned For
Owner Type
Purchase Details
Closed on
Apr 20, 2021
Sold by
Bm Re Llc
Bought by
Peterson Hans
Current Estimated Value
Home Financials for this Owner
Home Financials are based on the most recent Mortgage that was taken out on this home.
Original Mortgage
$272,000
Outstanding Balance
$268,537
Interest Rate
3%
Mortgage Type
New Conventional
Estimated Equity
$176,359
Purchase Details
Closed on
Aug 26, 2019
Sold by
Blackburn James L and Blackburn Rebecca Sue
Bought by
Bm Re Llc
Home Financials for this Owner
Home Financials are based on the most recent Mortgage that was taken out on this home.
Original Mortgage
$262,000
Interest Rate
3.7%
Purchase Details
Closed on
Oct 19, 2010
Sold by
Dykes Michael D and Dykes Kay K
Bought by
Blackburn James L and Blackburn Rebecca Sue
Home Financials for this Owner
Home Financials are based on the most recent Mortgage that was taken out on this home.
Original Mortgage
$120,000
Interest Rate
10%
Mortgage Type
Seller Take Back
Create a Home Valuation Report for This Property
The Home Valuation Report is an in-depth analysis detailing your home's value as well as a comparison with similar homes in the area
Home Values in the Area
Average Home Value in this Area
Purchase History
| Date | Buyer | Sale Price | Title Company |
|---|---|---|---|
| Peterson Hans | -- | Capstone Title | |
| Bm Re Llc | -- | Hickman Land Title Layton | |
| Blackburn James L | -- | Mountain View Title Ogden |
Source: Public Records
Mortgage History
| Date | Status | Borrower | Loan Amount |
|---|---|---|---|
| Open | Peterson Hans | $272,000 | |
| Previous Owner | Bm Re Llc | $262,000 | |
| Previous Owner | Blackburn James L | $120,000 |
Source: Public Records
Tax History
| Year | Tax Paid | Tax Assessment Tax Assessment Total Assessment is a certain percentage of the fair market value that is determined by local assessors to be the total taxable value of land and additions on the property. | Land | Improvement |
|---|---|---|---|---|
| 2025 | $3,146 | $407,328 | $110,321 | $297,007 |
| 2024 | $3,077 | $394,000 | $110,321 | $283,679 |
| 2023 | $2,921 | $378,000 | $103,238 | $274,762 |
| 2022 | $3,217 | $426,000 | $88,275 | $337,725 |
| 2021 | $2,269 | $264,000 | $58,062 | $205,938 |
| 2020 | $2,149 | $230,000 | $32,321 | $197,679 |
| 2019 | $2,028 | $202,000 | $32,321 | $169,679 |
| 2018 | $1,752 | $170,000 | $33,377 | $136,623 |
| 2017 | $1,687 | $152,000 | $33,377 | $118,623 |
| 2016 | $1,471 | $70,059 | $16,189 | $53,870 |
| 2015 | $1,434 | $66,606 | $16,189 | $50,417 |
| 2014 | $1,402 | $64,426 | $16,189 | $48,237 |
Source: Public Records
Map
Nearby Homes
- 3026 Harrison Blvd
- 3040 Harrison Blvd
- 2916 Brinker Ave
- 1119 Healy St
- 966 30th St
- 2843 Brinker Ave
- 1289 30th St
- 1010 Sullivan Rd
- 3175 Iowa Ave
- 1289 31st St
- 2839 S Van Buren Ave Unit 8
- 2864 Fowler Ave
- 1134 28th St
- 3120 Tyler Ave
- 917 Sullivan Dr
- 875 Patterson St
- 895 Sullivan Rd
- 1061 Doxey St
- 1260 28th St
- 3287 Van Buren Ave
- 1131 30th St
- 1117 30th St
- 3003 Brinker Ave
- 1101 30th St
- 1122 Patterson St
- 1130 Patterson St
- 1112 Patterson St
- 3035 Brinker Ave
- 3046 Van Buren Ave
- 1120 30th St
- 1104 30th St
- 1126 30th St
- 1132 30th St
- 1147 30th St
- 2978 Van Buren Ave
- 1095 30th St
- 2972 Van Buren Ave
- 2971 Brinker Ave
- 3015 Van Buren Ave
- 2982 Brinker Ave
Your Personal Tour Guide
Ask me questions while you tour the home.