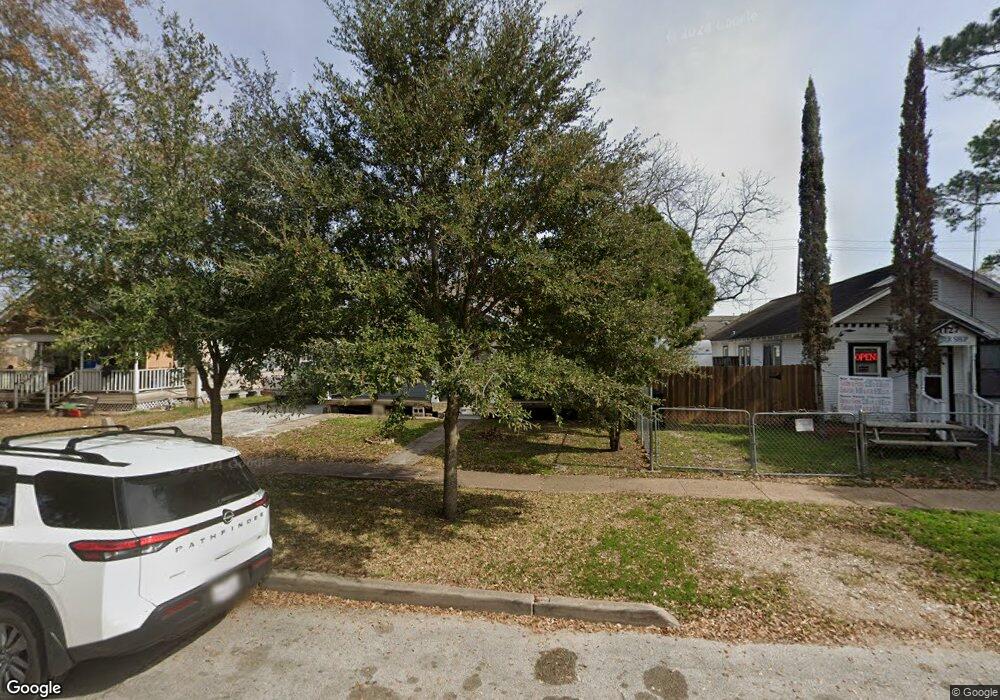
1123 6th St Rosenberg, TX 77471
Estimated Value: $114,000 - $181,000
Studio
--
Bath
768
Sq Ft
$186/Sq Ft
Est. Value
About This Home
This home is located at 1123 6th St, Rosenberg, TX 77471 and is currently estimated at $142,665, approximately $185 per square foot. 1123 6th St is a home located in Fort Bend County with nearby schools including Travis Elementary School, George Junior High School, and B.F. Terry High School.
Ownership History
Date
Name
Owned For
Owner Type
Purchase Details
Closed on
Aug 31, 2009
Sold by
Medina Abel A and Medina Mary
Bought by
Quinones Maria Elena
Current Estimated Value
Home Financials for this Owner
Home Financials are based on the most recent Mortgage that was taken out on this home.
Original Mortgage
$56,949
Outstanding Balance
$37,188
Interest Rate
5.16%
Mortgage Type
FHA
Estimated Equity
$105,477
Purchase Details
Closed on
May 10, 2001
Sold by
Diaz David R and Diaz Dolores R
Bought by
Medina Abel A and Medina Mary
Home Financials for this Owner
Home Financials are based on the most recent Mortgage that was taken out on this home.
Original Mortgage
$37,800
Interest Rate
6.99%
Purchase Details
Closed on
May 2, 2001
Sold by
Mellon Sidney
Bought by
Diaz David R and Diaz Dolores R
Home Financials for this Owner
Home Financials are based on the most recent Mortgage that was taken out on this home.
Original Mortgage
$37,800
Interest Rate
6.99%
Create a Home Valuation Report for This Property
The Home Valuation Report is an in-depth analysis detailing your home's value as well as a comparison with similar homes in the area
Home Values in the Area
Average Home Value in this Area
Purchase History
| Date | Buyer | Sale Price | Title Company |
|---|---|---|---|
| Quinones Maria Elena | -- | Fidelity National Title | |
| Medina Abel A | -- | First American Title | |
| Diaz David R | -- | First American Title |
Source: Public Records
Mortgage History
| Date | Status | Borrower | Loan Amount |
|---|---|---|---|
| Open | Quinones Maria Elena | $56,949 | |
| Previous Owner | Medina Abel A | $37,800 |
Source: Public Records
Tax History
| Year | Tax Paid | Tax Assessment Tax Assessment Total Assessment is a certain percentage of the fair market value that is determined by local assessors to be the total taxable value of land and additions on the property. | Land | Improvement |
|---|---|---|---|---|
| 2025 | $12 | $115,572 | $54,850 | $60,722 |
| 2024 | $12 | $110,969 | $43,431 | $67,538 |
| 2023 | $12 | $100,881 | $27,548 | $73,333 |
| 2022 | $280 | $91,710 | $25,600 | $66,110 |
| 2021 | $1,730 | $83,370 | $38,830 | $44,540 |
| 2020 | $1,609 | $75,790 | $38,290 | $37,500 |
| 2019 | $1,574 | $68,900 | $23,460 | $45,440 |
| 2018 | $1,454 | $62,640 | $23,460 | $39,180 |
| 2017 | $1,343 | $57,530 | $23,460 | $34,070 |
| 2016 | $1,306 | $55,970 | $23,460 | $32,510 |
| 2015 | $374 | $55,120 | $23,460 | $31,660 |
| 2014 | $989 | $53,675 | $23,460 | $30,215 |
Source: Public Records
Map
Nearby Homes
Your Personal Tour Guide
Ask me questions while you tour the home.