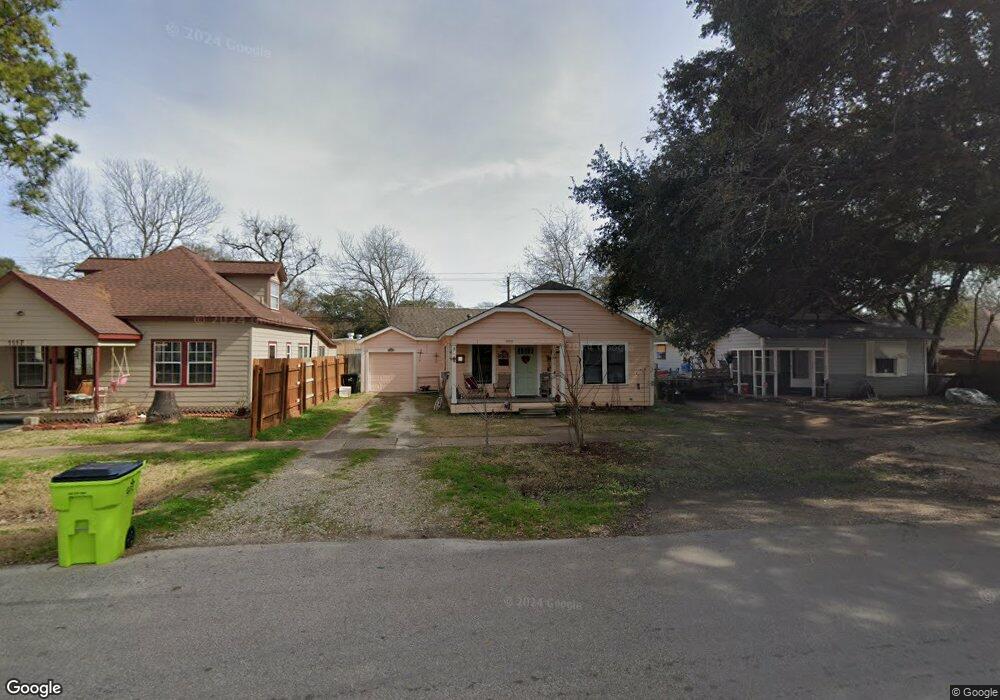
1123 7th St Rosenberg, TX 77471
Estimated Value: $210,000 - $236,000
3
Beds
2
Baths
1,600
Sq Ft
$140/Sq Ft
Est. Value
About This Home
This home is located at 1123 7th St, Rosenberg, TX 77471 and is currently estimated at $223,547, approximately $139 per square foot. 1123 7th St is a home located in Fort Bend County with nearby schools including Travis Elementary School, Navarro Middle School, and George Junior High School.
Ownership History
Date
Name
Owned For
Owner Type
Purchase Details
Closed on
Nov 6, 2015
Sold by
Medina Abel and Medina Mary
Bought by
Medina Properties Inc
Current Estimated Value
Purchase Details
Closed on
Dec 7, 2004
Sold by
Ueckert Milton W
Bought by
Medina Abel and Medina Mary
Purchase Details
Closed on
Nov 29, 2004
Sold by
Thompson Tim
Bought by
Ueckert Milton W and Knobloch Jean
Purchase Details
Closed on
Mar 27, 2004
Sold by
Ueckert Mary Kana
Bought by
Medina Properties Inc
Create a Home Valuation Report for This Property
The Home Valuation Report is an in-depth analysis detailing your home's value as well as a comparison with similar homes in the area
Home Values in the Area
Average Home Value in this Area
Purchase History
| Date | Buyer | Sale Price | Title Company |
|---|---|---|---|
| Medina Properties Inc | -- | -- | |
| Medina Abel | -- | First American Title | |
| Medina Properties Inc | -- | -- | |
| Ueckert Milton W | -- | First American Title | |
| Medina Properties Inc | -- | -- |
Source: Public Records
Tax History Compared to Growth
Tax History
| Year | Tax Paid | Tax Assessment Tax Assessment Total Assessment is a certain percentage of the fair market value that is determined by local assessors to be the total taxable value of land and additions on the property. | Land | Improvement |
|---|---|---|---|---|
| 2025 | $3,569 | $174,584 | $54,850 | $119,734 |
| 2024 | $3,569 | $188,933 | $54,850 | $134,083 |
| 2023 | $3,253 | $168,530 | $42,449 | $126,081 |
| 2022 | $3,224 | $157,390 | $42,450 | $114,940 |
| 2021 | $2,961 | $142,730 | $38,830 | $103,900 |
| 2020 | $2,786 | $131,270 | $38,290 | $92,980 |
| 2019 | $2,576 | $112,780 | $23,460 | $89,320 |
| 2018 | $2,349 | $101,210 | $23,460 | $77,750 |
| 2017 | $2,121 | $90,870 | $23,460 | $67,410 |
| 2016 | $2,049 | $87,780 | $23,460 | $64,320 |
| 2015 | $2,028 | $86,440 | $23,460 | $62,980 |
| 2014 | $1,968 | $82,860 | $23,460 | $59,400 |
Source: Public Records
Map
Nearby Homes