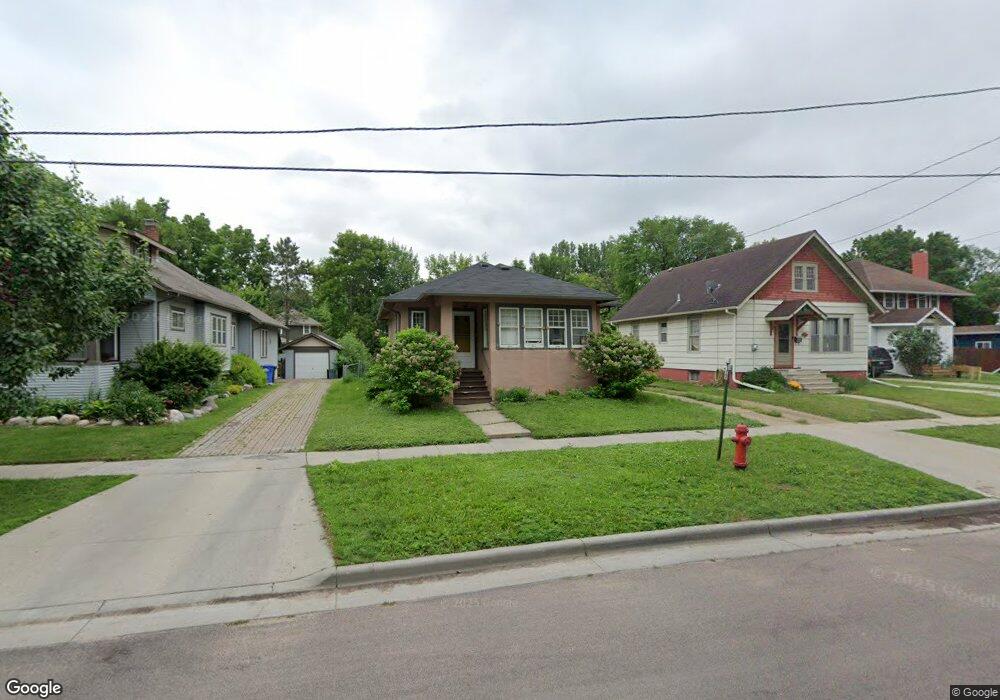
1123 8th St N Fargo, ND 58102
Roosevelt NeighborhoodEstimated Value: $200,000 - $233,807
2
Beds
1
Bath
1,982
Sq Ft
$108/Sq Ft
Est. Value
About This Home
This home is located at 1123 8th St N, Fargo, ND 58102 and is currently estimated at $213,202, approximately $107 per square foot. 1123 8th St N is a home located in Cass County with nearby schools including Horace Mann Roosevelt Elementary School, Ben Franklin Middle School, and North High School.
Ownership History
Date
Name
Owned For
Owner Type
Purchase Details
Closed on
Nov 24, 2020
Sold by
Harmsen Tun Carl and Harmsen Karen Lee
Bought by
Eduardo Nicholas and Yanez Rich Betsy
Current Estimated Value
Purchase Details
Closed on
May 22, 2020
Sold by
Hagensen Joshua M and Hagensen Jamie L
Bought by
Harmsen Tim and Harmsen Karen
Home Financials for this Owner
Home Financials are based on the most recent Mortgage that was taken out on this home.
Original Mortgage
$120,000
Outstanding Balance
$106,337
Interest Rate
3.3%
Mortgage Type
Commercial
Estimated Equity
$106,865
Purchase Details
Closed on
Feb 13, 2012
Sold by
Rabideaux Anthony J and Rabideaux April D
Bought by
Hagensen Joshua M and Hagensen Jamie L
Home Financials for this Owner
Home Financials are based on the most recent Mortgage that was taken out on this home.
Original Mortgage
$112,961
Interest Rate
4.15%
Mortgage Type
FHA
Create a Home Valuation Report for This Property
The Home Valuation Report is an in-depth analysis detailing your home's value as well as a comparison with similar homes in the area
Home Values in the Area
Average Home Value in this Area
Purchase History
| Date | Buyer | Sale Price | Title Company |
|---|---|---|---|
| Eduardo Nicholas | -- | None Available | |
| Harmsen Tim | $159,000 | Onpoint Title Serces Llc | |
| Hagensen Joshua M | $115,900 | None Available |
Source: Public Records
Mortgage History
| Date | Status | Borrower | Loan Amount |
|---|---|---|---|
| Open | Harmsen Tim | $120,000 | |
| Previous Owner | Hagensen Joshua M | $112,961 | |
| Closed | Eduardo Nicholas | $0 |
Source: Public Records
Tax History Compared to Growth
Tax History
| Year | Tax Paid | Tax Assessment Tax Assessment Total Assessment is a certain percentage of the fair market value that is determined by local assessors to be the total taxable value of land and additions on the property. | Land | Improvement |
|---|---|---|---|---|
| 2024 | $2,621 | $97,650 | $17,550 | $80,100 |
| 2023 | $2,531 | $94,800 | $17,550 | $77,250 |
| 2022 | $2,256 | $83,150 | $17,550 | $65,600 |
| 2021 | $1,978 | $74,250 | $17,550 | $56,700 |
| 2020 | $1,952 | $74,250 | $17,550 | $56,700 |
| 2019 | $1,997 | $60,550 | $8,150 | $52,400 |
| 2018 | $1,976 | $60,550 | $8,150 | $52,400 |
| 2017 | $1,885 | $57,650 | $8,150 | $49,500 |
| 2016 | $1,674 | $55,950 | $8,150 | $47,800 |
| 2015 | $1,693 | $53,200 | $6,900 | $46,300 |
| 2014 | $1,661 | $50,650 | $6,900 | $43,750 |
| 2013 | $1,620 | $48,250 | $6,900 | $41,350 |
Source: Public Records
Map
Nearby Homes