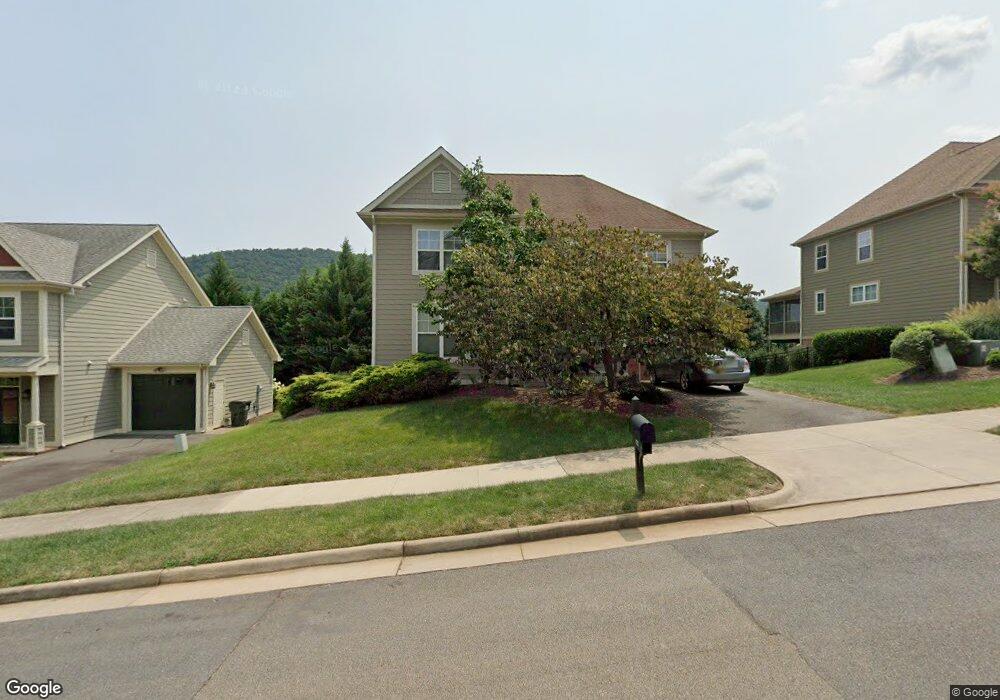
1123 Arden Dr Charlottesville, VA 22902
Estimated Value: $547,069 - $644,000
4
Beds
3
Baths
2,144
Sq Ft
$274/Sq Ft
Est. Value
About This Home
This home is located at 1123 Arden Dr, Charlottesville, VA 22902 and is currently estimated at $586,517, approximately $273 per square foot. 1123 Arden Dr is a home located in Albemarle County with nearby schools including Mountain View Elementary School, Walton Middle School, and Monticello High School.
Ownership History
Date
Name
Owned For
Owner Type
Purchase Details
Closed on
Jun 3, 2021
Sold by
Martensen Peter and Martensen Catherine
Bought by
Barnes Catherine
Current Estimated Value
Home Financials for this Owner
Home Financials are based on the most recent Mortgage that was taken out on this home.
Original Mortgage
$342,900
Outstanding Balance
$309,720
Interest Rate
2.75%
Mortgage Type
VA
Estimated Equity
$276,797
Purchase Details
Closed on
Aug 14, 2017
Sold by
Hazarika Surovi
Bought by
Martensen Peter and Barnes Catherine
Home Financials for this Owner
Home Financials are based on the most recent Mortgage that was taken out on this home.
Original Mortgage
$358,388
Interest Rate
4.12%
Mortgage Type
FHA
Purchase Details
Closed on
Dec 27, 2010
Sold by
Regions Bank
Bought by
Hazarika Surovi
Create a Home Valuation Report for This Property
The Home Valuation Report is an in-depth analysis detailing your home's value as well as a comparison with similar homes in the area
Home Values in the Area
Average Home Value in this Area
Purchase History
| Date | Buyer | Sale Price | Title Company |
|---|---|---|---|
| Barnes Catherine | -- | Transtar National Title | |
| Martensen Peter | $365,000 | Old Republic National Title | |
| Hazarika Surovi | $250,000 | None Available |
Source: Public Records
Mortgage History
| Date | Status | Borrower | Loan Amount |
|---|---|---|---|
| Open | Barnes Catherine | $342,900 | |
| Closed | Martensen Peter | $358,388 |
Source: Public Records
Tax History Compared to Growth
Tax History
| Year | Tax Paid | Tax Assessment Tax Assessment Total Assessment is a certain percentage of the fair market value that is determined by local assessors to be the total taxable value of land and additions on the property. | Land | Improvement |
|---|---|---|---|---|
| 2025 | $4,820 | $539,200 | $151,000 | $388,200 |
| 2024 | $4,367 | $511,300 | $145,000 | $366,300 |
| 2023 | $4,197 | $491,400 | $145,000 | $346,400 |
| 2022 | $3,546 | $415,200 | $110,000 | $305,200 |
| 2021 | $3,304 | $386,900 | $110,000 | $276,900 |
| 2020 | $3,255 | $381,200 | $110,000 | $271,200 |
| 2019 | $3,143 | $368,000 | $110,000 | $258,000 |
| 2018 | $2,875 | $350,000 | $110,000 | $240,000 |
| 2017 | $2,814 | $335,400 | $100,000 | $235,400 |
| 2016 | $2,504 | $298,400 | $100,000 | $198,400 |
| 2015 | $1,205 | $294,200 | $100,000 | $194,200 |
| 2014 | -- | $283,200 | $100,000 | $183,200 |
Source: Public Records
Map
Nearby Homes
- 1644 Hathaway St
- 1124 Arden Dr
- 4724 Loyola Way
- 217 Blackthorn Ln
- 1549 Reynovia Dr
- 3422 Montague St
- 2146 Avinity Loop
- 2126 Avinity Loop
- 3409 Montague St
- 3203 Bergen St
- The Aspen Plan at Galaxie Farm
- 36 Mary Jackson Ct
- 35A Mary Jackson Ct
- 5A Marie Curie Ct
- 50 Stone Mill Ct
- 2209 Swallowtail Ln
- 45 Wardell Crest
- 1129 Arden Dr
- 1117 Arden Dr
- 1135 Arden Dr
- 1130 Arden Dr
- 1118 Arden Dr
- 1112 Arden Dr
- 1136 Arden Dr
- 0 Arden Dr Unit 486096
- 1106 Arden Dr
- 1626 Hathaway St Unit A
- 1626 Hathaway St
- 1624 Hathaway St
- 1622 Hathaway St
- 1147 Arden Dr
- 1632 Hathaway St Unit A
- 1632 Hathaway St
- 1620 Hathaway St
- 1940 Avon Street Extension
- 1618 Hathaway St
- 1634 Hathaway St