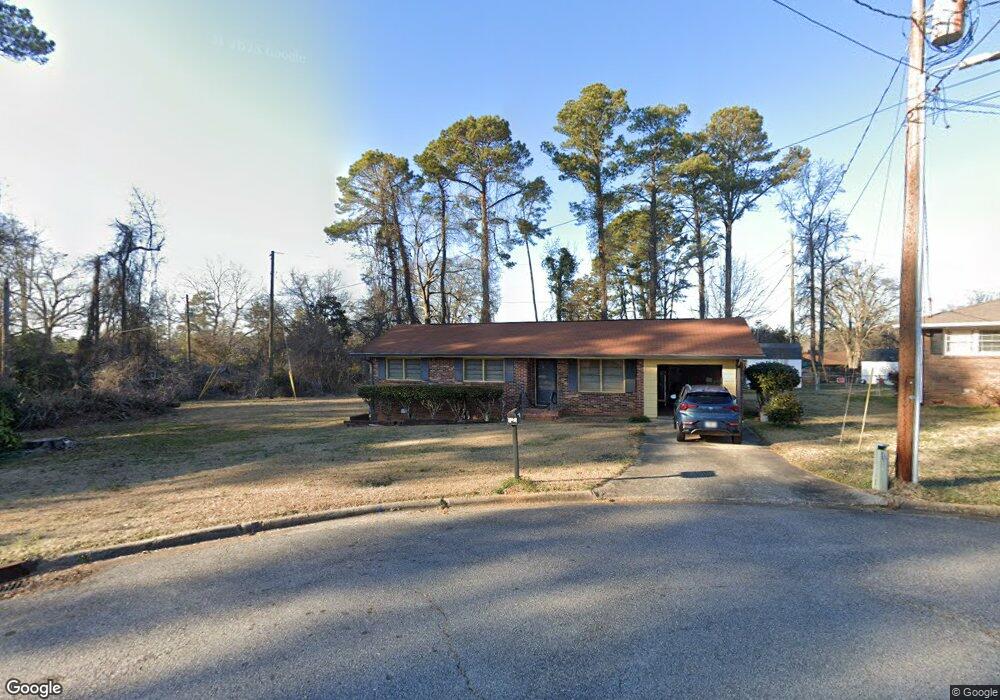
1123 Brentwood Cir Griffin, GA 30224
Spalding County NeighborhoodEstimated Value: $146,140 - $193,000
3
Beds
2
Baths
1,086
Sq Ft
$149/Sq Ft
Est. Value
About This Home
This home is located at 1123 Brentwood Cir, Griffin, GA 30224 and is currently estimated at $161,535, approximately $148 per square foot. 1123 Brentwood Cir is a home located in Spalding County with nearby schools including Moreland Road Elementary School, Carver Road Middle School, and Griffin High School.
Ownership History
Date
Name
Owned For
Owner Type
Purchase Details
Closed on
Aug 6, 2015
Sold by
Skipper Jerry W
Bought by
Skipper Jerry W and Skipper Noi
Current Estimated Value
Purchase Details
Closed on
Jul 15, 1987
Sold by
Skipper Jerry W
Bought by
Skipper Jerry W and Skipper Noi
Purchase Details
Closed on
May 28, 1987
Sold by
George N Murray Co Inc
Bought by
Skipper Jerry W
Purchase Details
Closed on
Jan 26, 1987
Sold by
Mccullough Lynne Thornton
Bought by
George N Murray Co Inc
Purchase Details
Closed on
Nov 1, 1974
Sold by
Mccullough Roy
Bought by
Mccullough Lynn Thornton
Purchase Details
Closed on
Feb 5, 1971
Sold by
Johnson Marvin
Bought by
Mccullough Roy
Purchase Details
Closed on
Sep 4, 1970
Sold by
Joiner James M
Bought by
Johnson Marvin
Purchase Details
Closed on
Dec 29, 1967
Sold by
Spalco Inc
Bought by
Joiner James M
Purchase Details
Closed on
Feb 1, 1967
Sold by
Spalding Real Estate & Construction Co
Bought by
Spalco Inc
Purchase Details
Closed on
Jan 5, 1967
Bought by
Spalding Real Estate & Construction Co
Create a Home Valuation Report for This Property
The Home Valuation Report is an in-depth analysis detailing your home's value as well as a comparison with similar homes in the area
Home Values in the Area
Average Home Value in this Area
Purchase History
| Date | Buyer | Sale Price | Title Company |
|---|---|---|---|
| Skipper Jerry W | -- | -- | |
| Skipper Jerry W | -- | -- | |
| Skipper Jerry W | -- | -- | |
| Skipper Jerry W | $47,200 | -- | |
| George N Murray Co Inc | $38,400 | -- | |
| Mccullough Lynn Thornton | $2,500 | -- | |
| Mccullough Roy | $19,300 | -- | |
| Johnson Marvin | $2,000 | -- | |
| Joiner James M | -- | -- | |
| Spalco Inc | -- | -- | |
| Spalding Real Estate & Construction Co | -- | -- |
Source: Public Records
Tax History Compared to Growth
Tax History
| Year | Tax Paid | Tax Assessment Tax Assessment Total Assessment is a certain percentage of the fair market value that is determined by local assessors to be the total taxable value of land and additions on the property. | Land | Improvement |
|---|---|---|---|---|
| 2024 | $562 | $37,659 | $5,280 | $32,379 |
| 2023 | $536 | $35,541 | $5,280 | $30,261 |
| 2022 | $460 | $31,663 | $4,560 | $27,103 |
| 2021 | $410 | $29,109 | $4,560 | $24,549 |
| 2020 | $413 | $29,109 | $4,560 | $24,549 |
| 2019 | $421 | $29,109 | $4,560 | $24,549 |
| 2018 | $0 | $26,822 | $4,560 | $22,262 |
| 2017 | $355 | $26,822 | $4,560 | $22,262 |
| 2016 | $487 | $26,822 | $4,560 | $22,262 |
| 2015 | $509 | $26,822 | $4,560 | $22,262 |
| 2014 | $514 | $26,822 | $4,560 | $22,262 |
Source: Public Records
Map
Nearby Homes
- 1610 Williamson Rd
- 450 Carver Rd
- 1723 Carrington Dr
- 1721 Carrington Dr
- 711 S Pine Hill Rd
- 1850 Carrington Dr
- 1707 Carrington Dr
- 1705 Carrington Dr
- 1740 Summerwoods Ln
- 1744 Summerwoods Ln
- 733 S Pine Hill Rd
- 1705 Summerwoods Ln
- 1729 Mary Ave
- 1613 Carriage Hills Dr
- 424 S Pine Hill Rd Unit 1
- 455 S Pine Hill Rd Unit 2
- 237 Raventree Ln
- 450 Carver
- 501 Oak Grove Rd
- 1611 Piedmont Rd
- 1125 Brentwood Cir
- 1124 Brentwood Cir
- 1618 Williamson Rd
- 1127 Brentwood Cir
- 1614 Williamson Rd
- 1126 Brentwood Cir
- 1620 Williamson Rd
- 1128 Brentwood Cir
- 1613 Brentwood Dr
- 1615 Brentwood Dr
- 1119 Carver Rd
- 1130 Brentwood Cir
- 1617 Brentwood Dr
- 1121 Carver Rd
- 1115 Carver Rd
- 1117 Carver Rd
- 1125 Carver Rd
- 1622 Williamson Rd
- 0 Brentwood Dr Unit 7516855
- 1127 Carver Rd