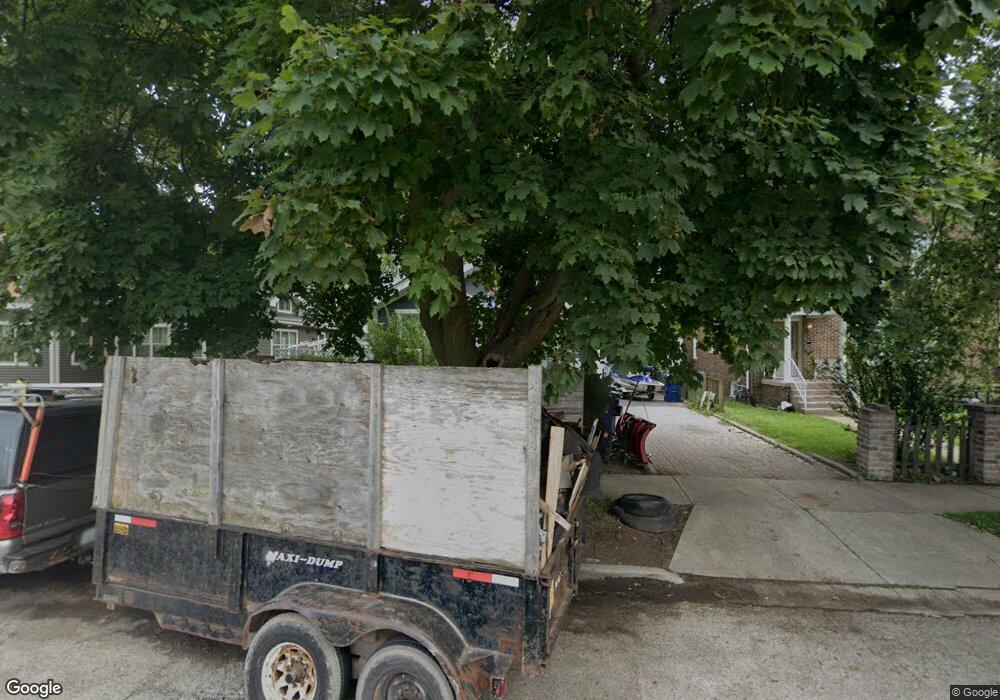
1123 Chestnut St Waukegan, IL 60085
Estimated Value: $172,015 - $215,000
2
Beds
1
Bath
948
Sq Ft
$206/Sq Ft
Est. Value
About This Home
This home is located at 1123 Chestnut St, Waukegan, IL 60085 and is currently estimated at $195,504, approximately $206 per square foot. 1123 Chestnut St is a home located in Lake County with nearby schools including Glen Flora Elementary School, Edith M Smith Middle School, and Waukegan High School.
Ownership History
Date
Name
Owned For
Owner Type
Purchase Details
Closed on
Apr 30, 2008
Sold by
Guadron Rafael Antonio and Guadron Ana Maria
Bought by
Guadron Rafael Antonio and Guadron Ana Maria
Current Estimated Value
Purchase Details
Closed on
Nov 5, 1999
Sold by
Gallego Cari
Bought by
Guadron Rafael and Guadron Ana Maria
Home Financials for this Owner
Home Financials are based on the most recent Mortgage that was taken out on this home.
Original Mortgage
$90,761
Outstanding Balance
$27,645
Interest Rate
7.72%
Mortgage Type
FHA
Estimated Equity
$167,859
Purchase Details
Closed on
May 1, 1996
Sold by
Ogrin William and Estate Of Edwin E Crawford Jr
Bought by
Gallego Cari
Create a Home Valuation Report for This Property
The Home Valuation Report is an in-depth analysis detailing your home's value as well as a comparison with similar homes in the area
Home Values in the Area
Average Home Value in this Area
Purchase History
| Date | Buyer | Sale Price | Title Company |
|---|---|---|---|
| Guadron Rafael Antonio | -- | None Available | |
| Guadron Rafael | $61,333 | First American Title | |
| Gallego Cari | $65,000 | -- |
Source: Public Records
Mortgage History
| Date | Status | Borrower | Loan Amount |
|---|---|---|---|
| Open | Guadron Rafael | $90,761 |
Source: Public Records
Tax History Compared to Growth
Tax History
| Year | Tax Paid | Tax Assessment Tax Assessment Total Assessment is a certain percentage of the fair market value that is determined by local assessors to be the total taxable value of land and additions on the property. | Land | Improvement |
|---|---|---|---|---|
| 2024 | $2,819 | $42,322 | $9,253 | $33,069 |
| 2023 | $2,995 | $37,891 | $8,285 | $29,606 |
| 2022 | $2,995 | $36,633 | $6,895 | $29,738 |
| 2021 | $2,785 | $32,713 | $6,150 | $26,563 |
| 2020 | $2,775 | $30,476 | $5,729 | $24,747 |
| 2019 | $2,740 | $27,927 | $5,250 | $22,677 |
| 2018 | $2,427 | $25,155 | $6,688 | $18,467 |
| 2017 | $2,312 | $22,255 | $5,917 | $16,338 |
| 2016 | $2,061 | $21,608 | $5,142 | $16,466 |
| 2015 | $2,253 | $19,339 | $4,602 | $14,737 |
| 2014 | $2,716 | $21,590 | $5,112 | $16,478 |
| 2012 | $2,681 | $23,392 | $5,539 | $17,853 |
Source: Public Records
Map
Nearby Homes
- 1110 N Ash St
- 918 N Ash St
- 1335 Chestnut St
- 1336 N Ash St
- 1105 Woodlawn Cir
- 917 N Linden Ave
- 1312 N Linden Ave
- 415 W Ridgeland Ave
- 1109 Massena Ave
- 1000 Pine St
- 620 N Poplar St
- 702 Franklin St
- 1018 W Atlantic Ave
- 616 W Keith Ave
- 1504 W Glen Flora Ave
- 824 N Butrick St
- 522 N Poplar St
- 325 4th St
- 723 N County St
- 1117 Judge Ave
- 1121 Chestnut St
- 1125 Chestnut St
- 1115 Chestnut St
- 1129 Chestnut St
- 1122 N Poplar St
- 1111 Chestnut St
- 1118 N Poplar St
- 1126 N Poplar St
- 1114 N Poplar St
- 1107 Chestnut St
- 1110 N Poplar St
- 720 Douglas Ave
- 1108 N Poplar St
- 1205 Chestnut St
- 1100 N Poplar St
- 1209 Chestnut St
- 1121 N Poplar St
- 1125 N Poplar St
- 1117 N Poplar St
- 1113 N Poplar St