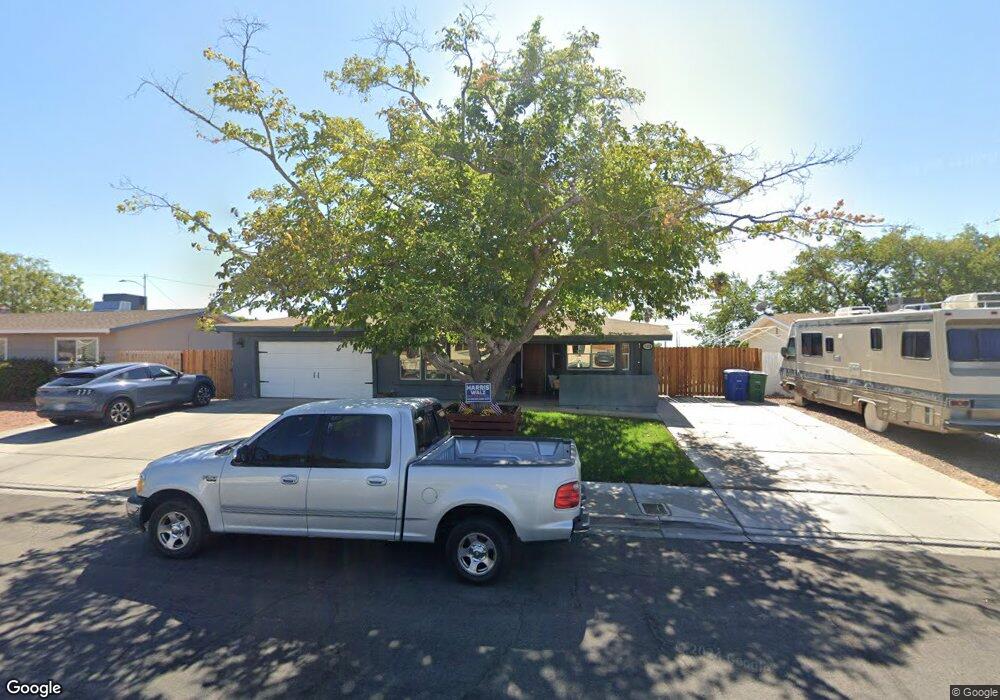
1123 Comanche Way Boulder City, NV 89005
Estimated Value: $509,000 - $558,000
3
Beds
2
Baths
2,286
Sq Ft
$232/Sq Ft
Est. Value
About This Home
This home is located at 1123 Comanche Way, Boulder City, NV 89005 and is currently estimated at $529,990, approximately $231 per square foot. 1123 Comanche Way is a home located in Clark County with nearby schools including Andrew Mitchell Elementary School, Martha P. King Elementary School, and Elton M. & Madelaine E. Garrett Junior High School.
Ownership History
Date
Name
Owned For
Owner Type
Purchase Details
Closed on
Apr 17, 2015
Sold by
Breeden Jeffrey A and Breeden Jennifer K
Bought by
Breeden Jeffrey A and Breeden Jennifer K
Current Estimated Value
Home Financials for this Owner
Home Financials are based on the most recent Mortgage that was taken out on this home.
Original Mortgage
$321,100
Outstanding Balance
$244,866
Interest Rate
3.8%
Mortgage Type
Unknown
Estimated Equity
$285,124
Purchase Details
Closed on
Jul 16, 2009
Sold by
Breeden Helen
Bought by
Breeden Jeffrey A and Breeden Jennifer K
Purchase Details
Closed on
Aug 5, 1996
Sold by
Breeden Harland E
Bought by
Breeden Helen
Create a Home Valuation Report for This Property
The Home Valuation Report is an in-depth analysis detailing your home's value as well as a comparison with similar homes in the area
Home Values in the Area
Average Home Value in this Area
Purchase History
| Date | Buyer | Sale Price | Title Company |
|---|---|---|---|
| Breeden Jeffrey A | -- | Nevada Title Las Vegas | |
| The Breeden Family Trust | -- | Nevada Title Las Vegas | |
| Breeden Jeffrey A | -- | None Available | |
| Breeden Helen | -- | Nevada Title Company |
Source: Public Records
Mortgage History
| Date | Status | Borrower | Loan Amount |
|---|---|---|---|
| Open | Breeden Jeffrey A | $321,100 |
Source: Public Records
Tax History
| Year | Tax Paid | Tax Assessment Tax Assessment Total Assessment is a certain percentage of the fair market value that is determined by local assessors to be the total taxable value of land and additions on the property. | Land | Improvement |
|---|---|---|---|---|
| 2026 | $1,624 | $87,736 | $56,000 | $31,736 |
| 2025 | $1,577 | $84,065 | $52,500 | $31,565 |
| 2024 | $1,531 | $84,065 | $52,500 | $31,565 |
| 2023 | $1,531 | $68,406 | $39,900 | $28,506 |
| 2022 | $1,487 | $61,981 | $35,000 | $26,981 |
| 2021 | $1,443 | $56,282 | $29,750 | $26,532 |
| 2020 | $1,401 | $54,095 | $26,950 | $27,145 |
| 2019 | $1,360 | $52,304 | $24,850 | $27,454 |
| 2018 | $1,321 | $51,218 | $24,150 | $27,068 |
| 2017 | $1,282 | $49,105 | $21,000 | $28,105 |
| 2016 | $1,254 | $50,418 | $21,000 | $29,418 |
| 2015 | $1,252 | $47,184 | $17,500 | $29,684 |
| 2014 | $1,215 | $45,847 | $15,750 | $30,097 |
Source: Public Records
Map
Nearby Homes
- 1119 Comanche Way
- 1127 Comanche Way
- 1216 Paiute Dr
- 1205 Cheyenne Ct
- 1202 Cheyenne Ct
- 1115 Comanche Way
- 1122 Comanche Way
- 1218 Paiute Dr
- 1209 Cheyenne Ct
- 1118 Comanche Way
- 1126 Comanche Way
- 1204 Cheyenne Ct
- 1111 Comanche Way
- 1114 Comanche Way
- 1215 Paiute Dr
- 1211 Paiute Dr
- 1220 Paiute Dr
- 1211 Cheyenne Ct
- 1211 Cheyenne Ct Unit none
- 1207 Paiute Dr
Your Personal Tour Guide
Ask me questions while you tour the home.