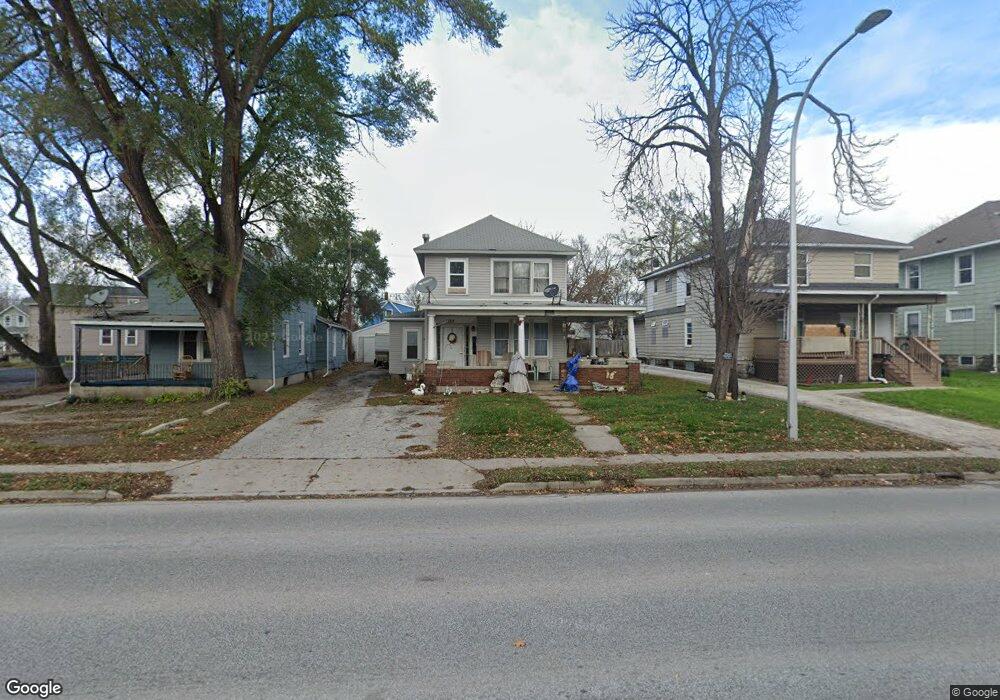
1123 Lapeer Ave Port Huron, MI 48060
Estimated Value: $135,000 - $172,000
6
Beds
4
Baths
2,744
Sq Ft
$54/Sq Ft
Est. Value
About This Home
This home is located at 1123 Lapeer Ave, Port Huron, MI 48060 and is currently estimated at $148,930, approximately $54 per square foot. 1123 Lapeer Ave is a home located in St. Clair County with nearby schools including Woodrow Wilson Elementary School, Holland Woods Middle School, and Port Huron High School.
Ownership History
Date
Name
Owned For
Owner Type
Purchase Details
Closed on
Dec 9, 2019
Sold by
Barcume and Beth
Bought by
Barcume Todd
Current Estimated Value
Purchase Details
Closed on
Jan 3, 2019
Sold by
Barcume Todd
Bought by
Barcume Todd and Barcume John
Purchase Details
Closed on
Mar 15, 2007
Sold by
Booth John and Booth Susan M
Bought by
Novastar Mortgage Inc
Purchase Details
Closed on
Jan 6, 2005
Sold by
Combs Kimball R and Combs Veronica A
Bought by
Booth John and Booth Susan M
Home Financials for this Owner
Home Financials are based on the most recent Mortgage that was taken out on this home.
Original Mortgage
$99,000
Interest Rate
5.78%
Mortgage Type
New Conventional
Create a Home Valuation Report for This Property
The Home Valuation Report is an in-depth analysis detailing your home's value as well as a comparison with similar homes in the area
Home Values in the Area
Average Home Value in this Area
Purchase History
| Date | Buyer | Sale Price | Title Company |
|---|---|---|---|
| Barcume Todd | -- | None Listed On Document | |
| Barcume Todd | -- | None Available | |
| Novastar Mortgage Inc | $88,000 | None Available | |
| Booth John | $110,000 | None Available |
Source: Public Records
Mortgage History
| Date | Status | Borrower | Loan Amount |
|---|---|---|---|
| Previous Owner | Booth John | $99,000 |
Source: Public Records
Tax History Compared to Growth
Tax History
| Year | Tax Paid | Tax Assessment Tax Assessment Total Assessment is a certain percentage of the fair market value that is determined by local assessors to be the total taxable value of land and additions on the property. | Land | Improvement |
|---|---|---|---|---|
| 2025 | $1,416 | $59,800 | $0 | $0 |
| 2024 | $1,192 | $53,200 | $0 | $0 |
| 2023 | $1,128 | $41,100 | $0 | $0 |
| 2022 | $1,079 | $32,900 | $0 | $0 |
| 2021 | $1,030 | $27,400 | $0 | $0 |
| 2020 | $1,035 | $25,700 | $25,700 | $0 |
| 2019 | $1,016 | $18,300 | $0 | $0 |
| 2018 | $994 | $18,300 | $0 | $0 |
| 2017 | $913 | $14,900 | $0 | $0 |
| 2016 | $802 | $14,900 | $0 | $0 |
| 2015 | $808 | $14,900 | $14,900 | $0 |
| 2014 | $808 | $15,000 | $15,000 | $0 |
| 2013 | -- | $15,000 | $0 | $0 |
Source: Public Records
Map
Nearby Homes
- 1127 Lapeer Ave
- 1119 Lapeer Ave
- 1115 Lapeer Ave
- 1133 Lapeer Ave
- 628 12th St
- 1116 Pearl St
- 1130 Pearl St
- 1118 Pearl St
- 1130 Lapeer Ave
- 1109 Lapeer Ave
- 635 11th St
- 633 11th St
- 1202/1204 Lapeer Ave
- 1103 Lapeer Ave
- 1124 Lapeer Ave
- 702 12th St Unit 704
- 1207 Lapeer Ave
- 631 11th St
- 627 12th St
- 1108 Lapeer Ave