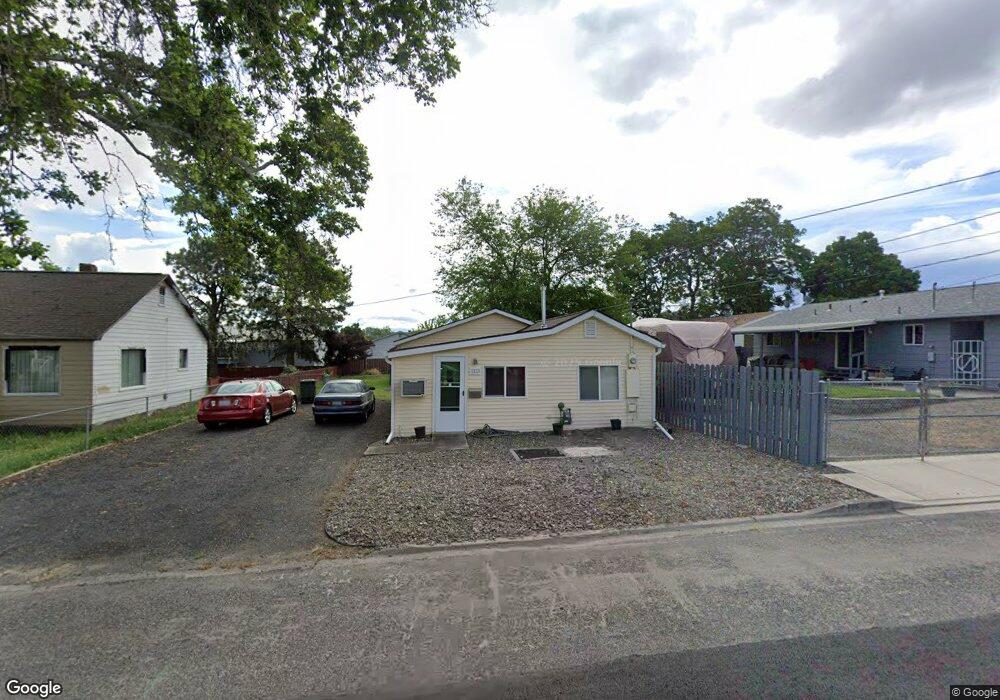
1123 McCarroll St Clarkston, WA 99403
Estimated Value: $232,276 - $262,000
2
Beds
1
Bath
864
Sq Ft
$287/Sq Ft
Est. Value
About This Home
This home is located at 1123 McCarroll St, Clarkston, WA 99403 and is currently estimated at $247,759, approximately $286 per square foot. 1123 McCarroll St is a home located in Asotin County with nearby schools including Parkway Elementary School, Lincoln Middle School, and Charles Francis Adams High School.
Ownership History
Date
Name
Owned For
Owner Type
Purchase Details
Closed on
Jul 19, 2011
Sold by
Storey Steven and Storey Judith
Bought by
Westphal Jay V
Current Estimated Value
Home Financials for this Owner
Home Financials are based on the most recent Mortgage that was taken out on this home.
Original Mortgage
$72,000
Outstanding Balance
$49,393
Interest Rate
4.45%
Mortgage Type
New Conventional
Estimated Equity
$198,366
Purchase Details
Closed on
Apr 26, 2007
Sold by
Overman Rolly
Bought by
Storey Steven and Storey Judith
Home Financials for this Owner
Home Financials are based on the most recent Mortgage that was taken out on this home.
Original Mortgage
$80,000
Interest Rate
6.14%
Mortgage Type
New Conventional
Purchase Details
Closed on
Jan 6, 2006
Sold by
Mcclain Samie L and Mcclain Barbara
Bought by
Overman Rolly
Purchase Details
Closed on
Jan 4, 2006
Sold by
Overman Sandra
Bought by
Overman Rolly
Create a Home Valuation Report for This Property
The Home Valuation Report is an in-depth analysis detailing your home's value as well as a comparison with similar homes in the area
Home Values in the Area
Average Home Value in this Area
Purchase History
| Date | Buyer | Sale Price | Title Company |
|---|---|---|---|
| Westphal Jay V | $90,000 | Alliance Title & Escrow | |
| Storey Steven | $80,000 | None Available | |
| Overman Rolly | -- | Alliance Title & Escrow Corp | |
| Overman Rolly | -- | Alliance Title & Escrow Corp |
Source: Public Records
Mortgage History
| Date | Status | Borrower | Loan Amount |
|---|---|---|---|
| Open | Westphal Jay V | $72,000 | |
| Previous Owner | Storey Steven | $80,000 |
Source: Public Records
Tax History Compared to Growth
Tax History
| Year | Tax Paid | Tax Assessment Tax Assessment Total Assessment is a certain percentage of the fair market value that is determined by local assessors to be the total taxable value of land and additions on the property. | Land | Improvement |
|---|---|---|---|---|
| 2021 | $4 | $82,400 | $28,000 | $54,400 |
| 2020 | $4 | $82,400 | $28,000 | $54,400 |
| 2019 | $659 | $60,500 | $28,000 | $32,500 |
| 2018 | $796 | $60,500 | $28,000 | $32,500 |
| 2017 | $746 | $60,500 | $28,000 | $32,500 |
| 2016 | $746 | $60,500 | $28,000 | $32,500 |
| 2015 | $0 | $82,500 | $28,000 | $54,500 |
| 2013 | $4 | $80,900 | $28,000 | $52,900 |
Source: Public Records
Map
Nearby Homes
- 1113 McCarroll St
- 1101 College Ct
- 1105 College Ct
- 1109 McCarroll St
- 1111 College Ct
- 1115 College Ct
- 1109 College Ct
- 1107 McCarroll St
- 1116 McCarroll St
- 1114 McCarroll St
- 1103 McCarroll St
- 1131 McCarroll St
- 1119 College Ct
- 1110 McCarroll St
- 1110 McCarroll St
- 1126 McCarroll St
- 1104 McCarroll St
- 1134 College Ct
- 1049 McCarroll St
- 1137 McCarroll St