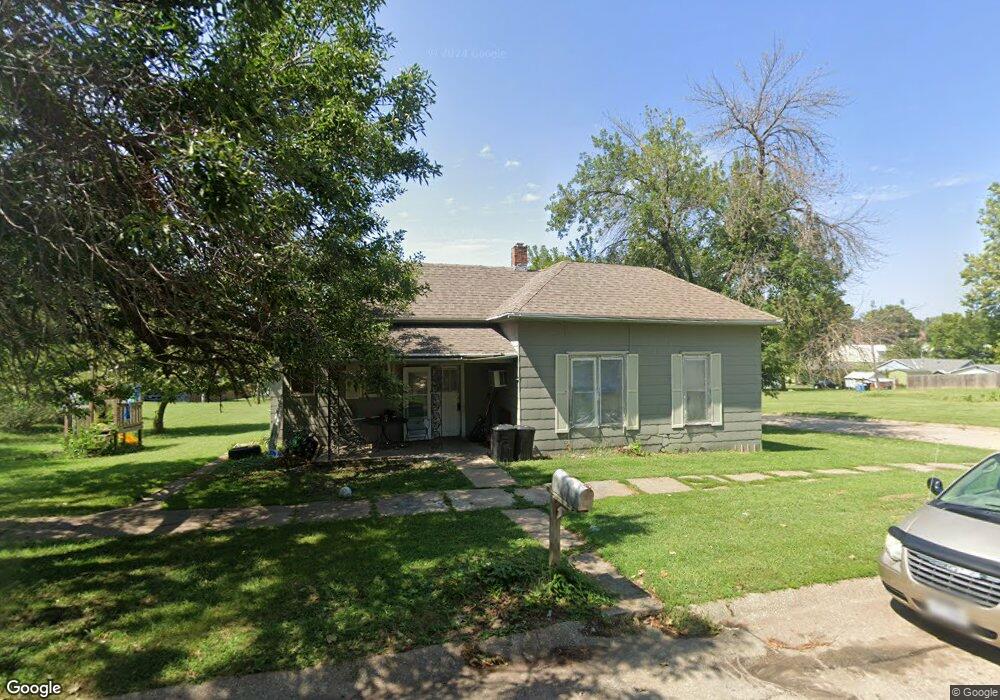
1123 Mclean St Falls City, NE 68355
Estimated Value: $53,000 - $74,000
2
Beds
1
Bath
984
Sq Ft
$60/Sq Ft
Est. Value
About This Home
This home is located at 1123 Mclean St, Falls City, NE 68355 and is currently estimated at $59,516, approximately $60 per square foot. 1123 Mclean St is a home located in Richardson County with nearby schools including Falls City North Elementary School, Falls City South Elementary School, and Falls City Middle School.
Ownership History
Date
Name
Owned For
Owner Type
Purchase Details
Closed on
Feb 23, 2009
Sold by
Elliott Monica Ann
Bought by
Dewald William O and Dewald Lina C
Current Estimated Value
Purchase Details
Closed on
Feb 10, 2009
Sold by
Elliott Monica Ann
Bought by
Dewald William O and Dewald Lina C
Purchase Details
Closed on
Sep 10, 2007
Sold by
Parrish Mary
Bought by
Elliott Monica Ann
Purchase Details
Closed on
Jan 3, 2007
Sold by
Schlicher William Frank
Bought by
Parrish Mary
Purchase Details
Closed on
Jul 21, 2006
Sold by
Pethoud Marvin K and Pethoud Virginia A
Bought by
Schlicher William Frank
Purchase Details
Closed on
Apr 19, 2005
Sold by
Hansen Louis R
Bought by
Pethoud Marvin K and Pethoud Virginia A
Create a Home Valuation Report for This Property
The Home Valuation Report is an in-depth analysis detailing your home's value as well as a comparison with similar homes in the area
Home Values in the Area
Average Home Value in this Area
Purchase History
| Date | Buyer | Sale Price | Title Company |
|---|---|---|---|
| Dewald William O | -- | -- | |
| Dewald William O | $5,000 | -- | |
| Elliott Monica Ann | $6,000 | -- | |
| Parrish Mary | -- | -- | |
| Schlicher William Frank | $10,200 | -- | |
| Pethoud Marvin K | $7,500 | -- |
Source: Public Records
Tax History Compared to Growth
Tax History
| Year | Tax Paid | Tax Assessment Tax Assessment Total Assessment is a certain percentage of the fair market value that is determined by local assessors to be the total taxable value of land and additions on the property. | Land | Improvement |
|---|---|---|---|---|
| 2025 | $252 | $20,749 | $4,500 | $16,249 |
| 2024 | $252 | $19,835 | $4,500 | $15,335 |
| 2023 | $212 | $12,940 | $4,500 | $8,440 |
| 2022 | $219 | $11,385 | $3,240 | $8,145 |
| 2021 | $208 | $11,111 | $3,240 | $7,871 |
| 2020 | $203 | $10,736 | $3,240 | $7,496 |
| 2019 | $202 | $10,518 | $3,240 | $7,278 |
| 2018 | $200 | $10,306 | $3,240 | $7,066 |
| 2017 | $201 | $10,306 | $3,240 | $7,066 |
| 2016 | $196 | $10,100 | $3,240 | $6,860 |
| 2015 | $196 | $10,100 | $3,240 | $6,860 |
| 2014 | $196 | $10,100 | $3,240 | $6,860 |
Source: Public Records
Map
Nearby Homes