Estimated Value: $211,000 - $227,000
4
Beds
2
Baths
1,488
Sq Ft
$148/Sq Ft
Est. Value
About This Home
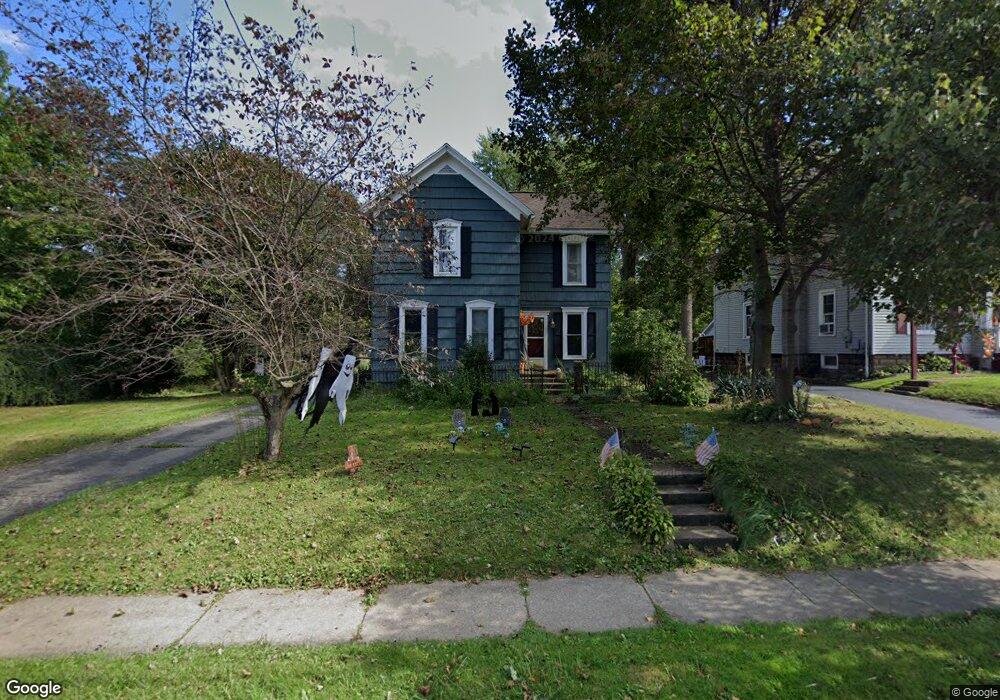
This home is located at 1123 N Mantua St, Kent, OH 44240 and is currently estimated at $220,484, approximately $148 per square foot. 1123 N Mantua St is a home located in Portage County with nearby schools including Walls Elementary School, Stanton Middle School, and Theodore Roosevelt High School.
Ownership History
Date
Name
Owned For
Owner Type
Purchase Details
Closed on
Jan 14, 2016
Sold by
Knuth Gary and Knuth Laurie
Bought by
Frampton Michael
Current Estimated Value
Home Financials for this Owner
Home Financials are based on the most recent Mortgage that was taken out on this home.
Original Mortgage
$85,000
Interest Rate
5%
Mortgage Type
Seller Take Back
Purchase Details
Closed on
Feb 18, 2011
Sold by
Crocker Timothy J
Bought by
Knuth Gary and Knuth Laurie
Home Financials for this Owner
Home Financials are based on the most recent Mortgage that was taken out on this home.
Original Mortgage
$78,500
Interest Rate
4.81%
Mortgage Type
New Conventional
Purchase Details
Closed on
Jan 25, 1999
Sold by
Estate Of Carl M Crocker
Bought by
Crocker Mary E
Purchase Details
Closed on
Jan 1, 1990
Bought by
Crocker Carl M
Create a Home Valuation Report for This Property
The Home Valuation Report is an in-depth analysis detailing your home's value as well as a comparison with similar homes in the area
Home Values in the Area
Average Home Value in this Area
Purchase History
| Date | Buyer | Sale Price | Title Company |
|---|---|---|---|
| Frampton Michael | $90,000 | Attorney | |
| Knuth Gary | $77,000 | Attorney | |
| Crocker Mary E | -- | -- | |
| Crocker Carl M | -- | -- |
Source: Public Records
Mortgage History
| Date | Status | Borrower | Loan Amount |
|---|---|---|---|
| Closed | Frampton Michael | $85,000 | |
| Closed | Knuth Gary | $78,500 |
Source: Public Records
Tax History Compared to Growth
Tax History
| Year | Tax Paid | Tax Assessment Tax Assessment Total Assessment is a certain percentage of the fair market value that is determined by local assessors to be the total taxable value of land and additions on the property. | Land | Improvement |
|---|---|---|---|---|
| 2024 | $2,854 | $62,060 | $12,040 | $50,020 |
| 2023 | $2,739 | $47,320 | $12,040 | $35,280 |
| 2022 | $2,723 | $47,320 | $12,040 | $35,280 |
| 2021 | $2,686 | $47,320 | $12,040 | $35,280 |
| 2020 | $2,619 | $39,830 | $12,040 | $27,790 |
| 2019 | $2,552 | $39,830 | $12,040 | $27,790 |
| 2018 | $2,433 | $35,350 | $12,600 | $22,750 |
| 2017 | $2,433 | $35,350 | $12,600 | $22,750 |
| 2016 | $2,428 | $35,350 | $12,600 | $22,750 |
| 2015 | $2,428 | $35,350 | $12,600 | $22,750 |
| 2014 | $2,469 | $35,350 | $12,600 | $22,750 |
| 2013 | $2,451 | $35,350 | $12,600 | $22,750 |
Source: Public Records
Map
Nearby Homes
- 1117 N Mantua St
- 322 E Grant St
- 318 E Grant St
- 1109 N Mantua St
- 314 E Grant St
- 327 Riverside Ct
- 319 Riverside Ct
- 323 Riverside Ct
- 312 E Grant St
- 315 Riverside Ct
- 1107 N Mantua St
- 310 E Grant St
- 1128 N Mantua St
- 1203 N Mantua St
- 1136 N Mantua St
- 327 E Grant St
- 323 E Grant St
- 319 E Grant St
- 308 E Grant St
- 1124 N Mantua St