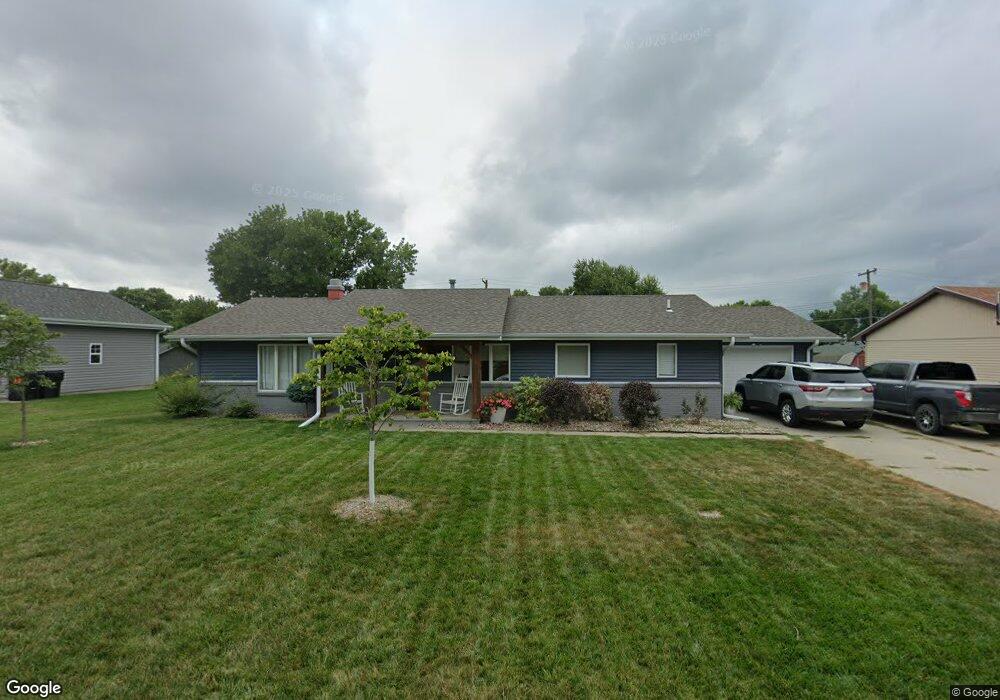
1123 Prinz St West Point, NE 68788
Estimated Value: $271,409 - $406,000
3
Beds
3
Baths
1,512
Sq Ft
$213/Sq Ft
Est. Value
About This Home
This home is located at 1123 Prinz St, West Point, NE 68788 and is currently estimated at $321,602, approximately $212 per square foot. 1123 Prinz St is a home located in Cuming County with nearby schools including West Point-Beemer Junior/Senior High School, Guardian Angels Elementary School, and St. Paul Lutheran School.
Ownership History
Date
Name
Owned For
Owner Type
Purchase Details
Closed on
Jun 1, 2015
Sold by
Penrose Ryan and Penrose Kari
Bought by
Holeka Christopher L and Holeka Hollie L
Current Estimated Value
Home Financials for this Owner
Home Financials are based on the most recent Mortgage that was taken out on this home.
Original Mortgage
$171,830
Outstanding Balance
$131,944
Interest Rate
3.75%
Mortgage Type
FHA
Estimated Equity
$189,658
Purchase Details
Closed on
Sep 29, 2011
Sold by
Tietz Leota H
Bought by
Penrose Ryan and Penrose Kari
Home Financials for this Owner
Home Financials are based on the most recent Mortgage that was taken out on this home.
Original Mortgage
$102,400
Interest Rate
4.24%
Mortgage Type
New Conventional
Purchase Details
Closed on
Apr 24, 2011
Sold by
Tietz Leota H
Bought by
Tietz Leota H
Create a Home Valuation Report for This Property
The Home Valuation Report is an in-depth analysis detailing your home's value as well as a comparison with similar homes in the area
Home Values in the Area
Average Home Value in this Area
Purchase History
| Date | Buyer | Sale Price | Title Company |
|---|---|---|---|
| Holeka Christopher L | $175,000 | None Available | |
| Penrose Ryan | $128,000 | -- | |
| Tietz Leota H | -- | -- |
Source: Public Records
Mortgage History
| Date | Status | Borrower | Loan Amount |
|---|---|---|---|
| Open | Holeka Christopher L | $171,830 | |
| Previous Owner | Penrose Ryan | $102,400 |
Source: Public Records
Tax History Compared to Growth
Tax History
| Year | Tax Paid | Tax Assessment Tax Assessment Total Assessment is a certain percentage of the fair market value that is determined by local assessors to be the total taxable value of land and additions on the property. | Land | Improvement |
|---|---|---|---|---|
| 2025 | $2,009 | $253,325 | $27,090 | $226,235 |
| 2024 | $2,009 | $235,670 | $27,090 | $208,580 |
| 2023 | $2,523 | $218,655 | $23,940 | $194,715 |
| 2022 | $2,514 | $198,695 | $23,940 | $174,755 |
| 2021 | $2,388 | $179,255 | $22,050 | $157,205 |
| 2020 | $2,271 | $170,010 | $22,050 | $147,960 |
| 2019 | $2,217 | $162,220 | $22,050 | $140,170 |
| 2018 | $1,990 | $144,985 | $22,050 | $122,935 |
| 2017 | $2,034 | $144,985 | $22,050 | $122,935 |
| 2016 | $1,987 | $137,545 | $19,530 | $118,015 |
| 2015 | $2,114 | $137,545 | $19,530 | $118,015 |
| 2014 | $877 | $125,725 | $19,530 | $106,195 |
| 2013 | $877 | $125,725 | $19,530 | $106,195 |
Source: Public Records
Map
Nearby Homes
- 1124 Prinz St
- 640 Hillcrest Rd
- 1139 Prinz St
- 1104 Prinz St
- 1138 Prinz St
- 323 Colonial Cir
- 1155 Prinz St
- 321 E Weiler St
- 1055 Prinz St
- 1156 Prinz St
- 324 Colonial Cir
- 742 Hillcrest Rd
- 322 E Weiler St
- 320 E Weiler St
- 1056 Prinz St
- 325 Colonial Cir
- 1037 Prinz St
- 319 E Weiler St
- 1245 Prinz St
- 760 Hillcrest Rd