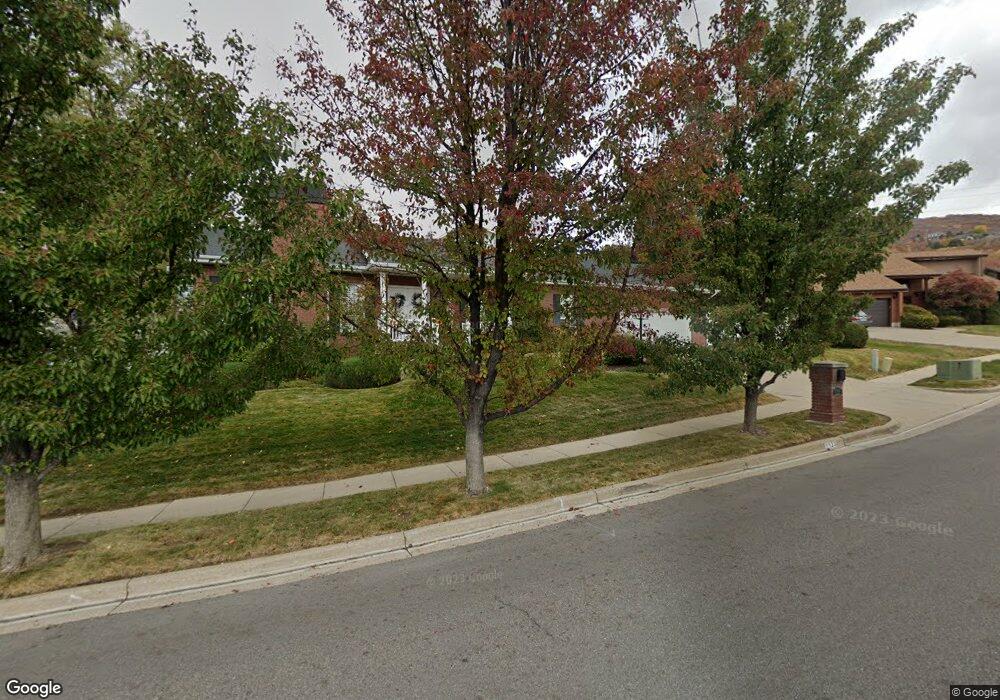
1123 S 1500 E Bountiful, UT 84010
Estimated Value: $711,000 - $793,000
5
Beds
3
Baths
3,200
Sq Ft
$229/Sq Ft
Est. Value
About This Home
This home is located at 1123 S 1500 E, Bountiful, UT 84010 and is currently estimated at $734,327, approximately $229 per square foot. 1123 S 1500 E is a home located in Davis County with nearby schools including Oak Hills School, Millcreek Junior High School, and Bountiful High School.
Ownership History
Date
Name
Owned For
Owner Type
Purchase Details
Closed on
Jun 11, 2024
Sold by
Aramaki Kristine M
Bought by
Shirley Kai Llc
Current Estimated Value
Purchase Details
Closed on
Apr 6, 2023
Sold by
Aramaki Teresa N
Bought by
Aramaki Kristine M
Home Financials for this Owner
Home Financials are based on the most recent Mortgage that was taken out on this home.
Original Mortgage
$325,000
Interest Rate
6.5%
Mortgage Type
New Conventional
Purchase Details
Closed on
Jan 5, 2001
Sold by
Allen Mark V and Allen Susanne M
Bought by
Jensen Carlyn Phinney
Purchase Details
Closed on
Jun 26, 1996
Sold by
Major Thomas D and Major Vikki V
Bought by
Allen Mark and Allen Susanne M
Home Financials for this Owner
Home Financials are based on the most recent Mortgage that was taken out on this home.
Original Mortgage
$207,000
Interest Rate
8.09%
Create a Home Valuation Report for This Property
The Home Valuation Report is an in-depth analysis detailing your home's value as well as a comparison with similar homes in the area
Purchase History
| Date | Buyer | Sale Price | Title Company |
|---|---|---|---|
| Shirley Kai Llc | -- | Paramount Title | |
| Aramaki Kristine M | -- | Paramount Title | |
| Aramaki Kristine M | -- | Inwest Title | |
| Jensen Carlyn Phinney | -- | Associated Title Company | |
| Allen Mark | -- | Associated Title Company |
Source: Public Records
Mortgage History
| Date | Status | Borrower | Loan Amount |
|---|---|---|---|
| Previous Owner | Aramaki Kristine M | $325,000 | |
| Previous Owner | Allen Mark | $207,000 |
Source: Public Records
Tax History
| Year | Tax Paid | Tax Assessment Tax Assessment Total Assessment is a certain percentage of the fair market value that is determined by local assessors to be the total taxable value of land and additions on the property. | Land | Improvement |
|---|---|---|---|---|
| 2025 | $3,963 | $361,350 | $142,595 | $218,755 |
| 2024 | $3,644 | $342,649 | $131,221 | $211,428 |
| 2023 | $2,364 | $610,000 | $241,237 | $368,763 |
| 2022 | $4,024 | $379,500 | $128,921 | $250,579 |
| 2021 | $760 | $523,000 | $191,899 | $331,101 |
| 2020 | $3,183 | $461,000 | $174,661 | $286,339 |
| 2019 | $3,116 | $440,000 | $164,763 | $275,237 |
| 2018 | $2,968 | $413,000 | $154,028 | $258,972 |
| 2016 | $193 | $197,230 | $75,431 | $121,799 |
| 2015 | $2,690 | $192,280 | $75,431 | $116,849 |
| 2014 | $1,205 | $254,474 | $75,431 | $179,043 |
| 2013 | -- | $164,633 | $61,874 | $102,759 |
Source: Public Records
Map
Nearby Homes
- 0 Lot Bountiful Blvd
- 1596 E Millbrook Way
- 1735 S Temple Ct Unit 203
- 1785 1450 E Unit 604
- 1475 Mueller Park Rd
- 1987 Mapleview Dr
- 1820 S High Pointe Dr
- 1087 Arlington Way
- 1878 E Ridge Point Dr
- 861 E Millbrook Way
- 795 Abby Ln Unit 5
- 771 E 1825 S
- 2136 Elaine Dr
- 631 E 1700 S
- 1997 S 800 E
- 1676 E Mueller Park Rd
- 842 E 2150 S
- 111 Eagle Ridge Dr
- 2091 Windsor Park Cir
- 380 E 1500 S
- 1090 S 1500 E
- 1504 Lakeview Dr
- 1149 S 1500 E
- 1174 S 1500 E
- 1148 S 1500 E
- 1496 Lakeview Dr
- 1511 Lakeview Dr Unit 303
- 1511 Lakeview Dr
- 1505 Lakeview Dr
- 1511 Lakeview Dr Unit 303
- 1493 Lakeview Dr Unit 301
- 1493 Lakeview Dr
- 1506 Lakeview Dr
- 1092 Barton Ct
- 1087 Lakecrest Rd Unit 7
- 1173 S 1500 E
- 1488 Lakecrest Rd Unit RD10
- 1535 Lakeview Dr
- 1093 Barton Ct
- 1502 Lakecrest Rd
Your Personal Tour Guide
Ask me questions while you tour the home.