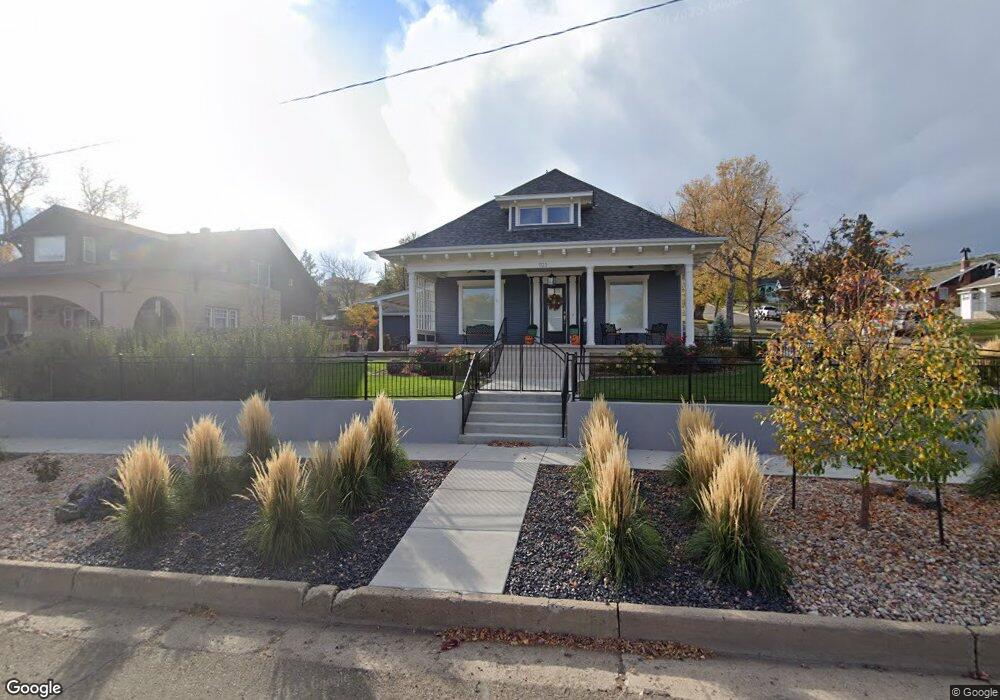
1123 San Juan St Trinidad, CO 81082
Estimated Value: $263,295 - $306,000
3
Beds
1
Bath
2,923
Sq Ft
$96/Sq Ft
Est. Value
About This Home
This home is located at 1123 San Juan St, Trinidad, CO 81082 and is currently estimated at $281,324, approximately $96 per square foot. 1123 San Juan St is a home with nearby schools including Fisher's Peak Elementary School, Trinidad Middle School, and Trinidad High School.
Ownership History
Date
Name
Owned For
Owner Type
Purchase Details
Closed on
Jul 23, 2021
Sold by
Soco Journey Llc
Bought by
Epper Rhonda M and Pride Myland E
Current Estimated Value
Purchase Details
Closed on
Jul 6, 2020
Sold by
Epper Rhonda M and Pride Myland E
Bought by
Soco Journey Llc
Home Financials for this Owner
Home Financials are based on the most recent Mortgage that was taken out on this home.
Original Mortgage
$300,000
Interest Rate
3.3%
Mortgage Type
New Conventional
Purchase Details
Closed on
Mar 4, 2020
Sold by
Loandepotcom Llc
Bought by
Epper Rhonda M and Pride Myland E
Purchase Details
Closed on
Oct 21, 2019
Sold by
Loandepotcom Llc
Bought by
Miller Michelle R
Purchase Details
Closed on
Jun 23, 2014
Sold by
Roy Duane E
Bought by
Miller Michelle R
Home Financials for this Owner
Home Financials are based on the most recent Mortgage that was taken out on this home.
Original Mortgage
$82,500
Interest Rate
7%
Mortgage Type
Purchase Money Mortgage
Create a Home Valuation Report for This Property
The Home Valuation Report is an in-depth analysis detailing your home's value as well as a comparison with similar homes in the area
Home Values in the Area
Average Home Value in this Area
Purchase History
| Date | Buyer | Sale Price | Title Company |
|---|---|---|---|
| Epper Rhonda M | -- | None Available | |
| Soco Journey Llc | -- | None Available | |
| Epper Rhonda M | $130,000 | None Available | |
| Miller Michelle R | -- | -- | |
| Miller Michelle R | $82,500 | None Available |
Source: Public Records
Mortgage History
| Date | Status | Borrower | Loan Amount |
|---|---|---|---|
| Previous Owner | Soco Journey Llc | $300,000 | |
| Previous Owner | Miller Michelle R | $82,500 |
Source: Public Records
Tax History Compared to Growth
Tax History
| Year | Tax Paid | Tax Assessment Tax Assessment Total Assessment is a certain percentage of the fair market value that is determined by local assessors to be the total taxable value of land and additions on the property. | Land | Improvement |
|---|---|---|---|---|
| 2025 | $805 | $20,360 | $1,680 | $18,680 |
| 2024 | $805 | $18,700 | $1,680 | $17,020 |
| 2023 | $805 | $15,020 | $1,350 | $13,670 |
| 2022 | $449 | $8,690 | $1,740 | $6,950 |
| 2021 | $457 | $8,940 | $1,790 | $7,150 |
| 2020 | $285 | $5,670 | $1,790 | $3,880 |
| 2019 | $3 | $5,670 | $1,790 | $3,880 |
| 2018 | $323 | $6,310 | $1,990 | $4,320 |
| 2017 | $314 | $6,310 | $0 | $0 |
| 2015 | $307 | $6,317 | $0 | $0 |
| 2013 | $342 | $6,805 | $1,993 | $4,812 |
Source: Public Records
Map
Nearby Homes