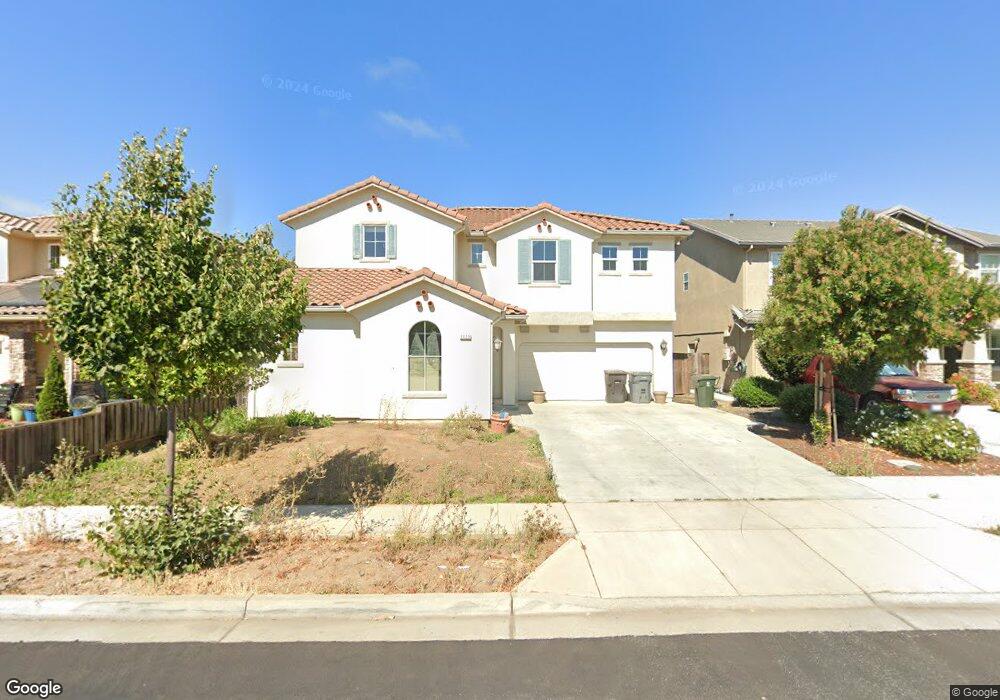
1123 Siena Way Salinas, CA 93905
East Salinas NeighborhoodEstimated Value: $898,954 - $1,004,000
About This Home
This home is located at 1123 Siena Way, Salinas, CA 93905 and is currently estimated at $939,489, approximately $352 per square foot. 1123 Siena Way is a home with nearby schools including Monte Bella Elementary School, El Sausal Middle School, and Alisal High School.
Ownership History
We collect this data history from publicly available records. To have your information removed, we recommend requesting removal directly through your county’s website.
Purchase Details
Home Financials for this Owner
Home Financials are based on the most recent Mortgage that was taken out on this home.Purchase Details
Home Values in the Area
Average Home Value in this Area
Purchase History
We collect this data history from publicly available records. To have your information removed, we recommend requesting removal directly through your county’s website.
| Date | Buyer | Sale Price | Title Company |
|---|---|---|---|
| $558,000 | Amity Title Company | ||
| $3,738,000 | Old Republic Title Company |
Mortgage History
We collect this data history from publicly available records. To have your information removed, we recommend requesting removal directly through your county’s website.
| Date | Status | Borrower | Loan Amount |
|---|---|---|---|
| Open | $544,100 |
Tax History
We collect this data history from publicly available records. To have your information removed, we recommend requesting removal directly through your county’s website.
| Year | Tax Paid | Tax Assessment Tax Assessment Total Assessment is a certain percentage of the fair market value that is determined by local assessors to be the total taxable value of land and additions on the property. | Land | Improvement |
|---|---|---|---|---|
| 2025 | $7,871 | $670,563 | $180,271 | $490,292 |
| 2024 | $7,871 | $657,416 | $176,737 | $480,679 |
| 2023 | $7,272 | $644,526 | $173,272 | $471,254 |
| 2022 | $6,700 | $631,889 | $169,875 | $462,014 |
| 2021 | $6,927 | $619,500 | $166,545 | $452,955 |
| 2020 | $6,667 | $613,149 | $164,838 | $448,311 |
| 2019 | $6,871 | $601,127 | $161,606 | $439,521 |
| 2018 | $6,549 | $589,341 | $158,438 | $430,903 |
| 2017 | $6,786 | $577,786 | $155,332 | $422,454 |
| 2016 | $6,488 | $566,458 | $152,287 | $414,171 |
| 2015 | $3,819 | $429,000 | $80,000 | $349,000 |
| 2014 | $1,711 | $70,317 | $70,317 | $0 |
Map
- 1564 Verona Ct
- 1700 Piazza Dr
- 1413 Wiren St
- 1185 Raven Ct
- 1230 Paseo Grande
- 1119 C St
- 1401 Grandhaven St
- 1066 Eagle Dr
- 85 Paloma Ave
- 1015 Eagle Dr
- 1425 E Alisal St
- 1238 Tahiti Place
- 838 Caribbean Ave
- 1380 Mazatlan St
- 821 Tumbleweed Dr Unit 5
- 717 Las Casitas Dr
- 11 Hill Cir
- 11 E Laurel Dr
- 704 Garner Ave Unit 30
- 10 Saint Regis Cir
Ask me questions while you tour the home.