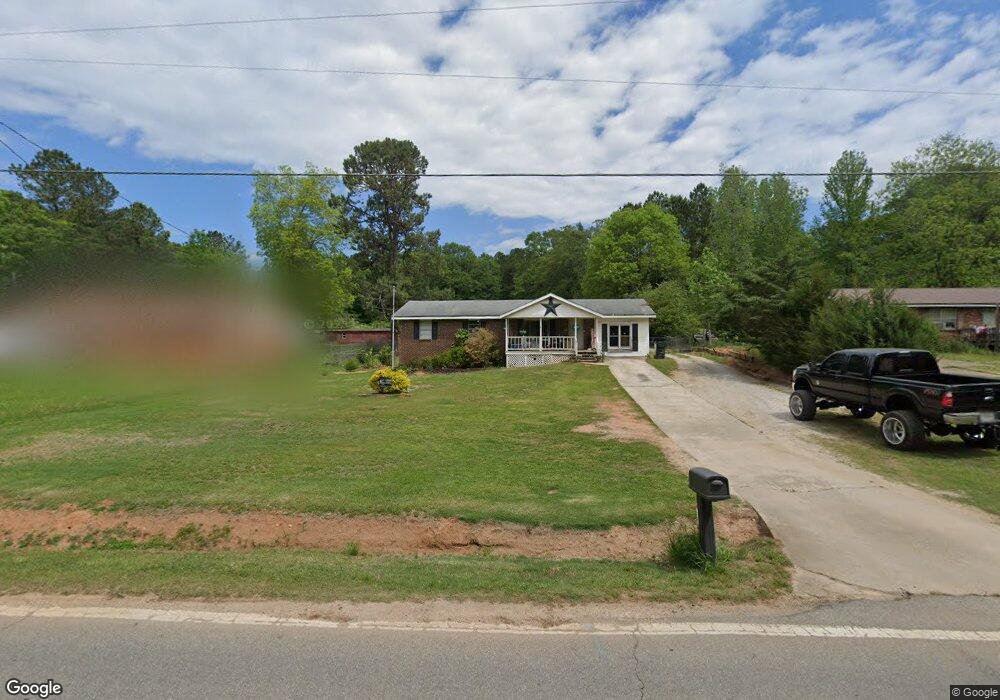
1123 Vineyard Rd Griffin, GA 30223
Spalding County NeighborhoodEstimated Value: $175,000 - $217,000
3
Beds
2
Baths
1,482
Sq Ft
$135/Sq Ft
Est. Value
About This Home
This home is located at 1123 Vineyard Rd, Griffin, GA 30223 and is currently estimated at $199,862, approximately $134 per square foot. 1123 Vineyard Rd is a home located in Spalding County with nearby schools including Cowan Road Elementary School, Cowan Road Middle School, and Griffin High School.
Ownership History
Date
Name
Owned For
Owner Type
Purchase Details
Closed on
Jun 18, 1999
Sold by
Foster Stephen E and Foster Kay W
Bought by
Lewis Roger B
Current Estimated Value
Home Financials for this Owner
Home Financials are based on the most recent Mortgage that was taken out on this home.
Original Mortgage
$56,250
Outstanding Balance
$14,933
Interest Rate
7.13%
Mortgage Type
New Conventional
Estimated Equity
$184,929
Purchase Details
Closed on
Apr 9, 1981
Sold by
Bogdovics Francis and Bogdovics Janice A
Bought by
Foster Steven E and Foster Kay
Purchase Details
Closed on
Jun 12, 1976
Sold by
Bibrowski Fred and Bibrowski Annette P
Bought by
Bogdovics Francis and Bogdovics Janice A
Purchase Details
Closed on
Jul 1, 1974
Sold by
Bibrowski Fred
Bought by
Bibrowski Fred and Bibrowski Annette P
Purchase Details
Closed on
Apr 9, 1974
Sold by
Bramlett Joe L and Bramlett Sherman
Bought by
Bibrowski Fred
Purchase Details
Closed on
May 9, 1973
Sold by
Slade Realty Inc
Bought by
Bramlett Joe L and Bramlett Sherman
Purchase Details
Closed on
Feb 1, 1973
Bought by
Slade Realty Inc
Create a Home Valuation Report for This Property
The Home Valuation Report is an in-depth analysis detailing your home's value as well as a comparison with similar homes in the area
Home Values in the Area
Average Home Value in this Area
Purchase History
| Date | Buyer | Sale Price | Title Company |
|---|---|---|---|
| Lewis Roger B | $75,000 | -- | |
| Foster Steven E | -- | -- | |
| Bogdovics Francis | -- | -- | |
| Bibrowski Fred | -- | -- | |
| Bibrowski Fred | $24,600 | -- | |
| Bramlett Joe L | $2,000 | -- | |
| Slade Realty Inc | -- | -- |
Source: Public Records
Mortgage History
| Date | Status | Borrower | Loan Amount |
|---|---|---|---|
| Open | Lewis Roger B | $56,250 |
Source: Public Records
Tax History Compared to Growth
Tax History
| Year | Tax Paid | Tax Assessment Tax Assessment Total Assessment is a certain percentage of the fair market value that is determined by local assessors to be the total taxable value of land and additions on the property. | Land | Improvement |
|---|---|---|---|---|
| 2024 | $1,456 | $42,515 | $2,650 | $39,865 |
| 2023 | $1,456 | $39,638 | $2,650 | $36,988 |
| 2022 | $1,165 | $33,835 | $2,650 | $31,185 |
| 2021 | $1,046 | $30,564 | $2,650 | $27,914 |
| 2020 | $1,050 | $30,564 | $2,650 | $27,914 |
| 2019 | $1,070 | $30,564 | $2,650 | $27,914 |
| 2018 | $989 | $27,683 | $2,650 | $25,033 |
| 2017 | $962 | $27,683 | $2,650 | $25,033 |
| 2016 | $979 | $27,683 | $2,650 | $25,033 |
| 2015 | $1,009 | $27,683 | $2,650 | $25,033 |
| 2014 | $1,100 | $27,683 | $2,650 | $25,033 |
Source: Public Records
Map
Nearby Homes
- 204 Vineyard Ridge Dr
- 1156 Burgundy Dr
- 1022 Serene Lake Dr
- 1115 Burgundy Dr
- 110 Janie Ln
- 813 Vineyard Rd
- 313 Sammy Cir
- 265 Steele Rd
- 114 King Richard Dr
- 78 Helen Dr
- 611A Seminole Dr
- 475 Edwards Rd
- 4920 Fayetteville Rd
- 4940 Fayetteville Rd
- 4946 Fayetteville Rd
- 111 Patterson Rd
- 101 Lexington Place Dr
- 1972 Pinecrest Dr Unit 4
- 208 Tyler Trace
- 1949 Bonnie Ridge Dr
- 1115 Vineyard Rd
- 1133 Vineyard Rd
- 1245 Vineyard Rd
- 1103 Vineyard Rd
- 1117 Vineyard Rd
- 1119 Vineyard Rd
- 1091 Vineyard Rd
- 1085 Vineyard Rd
- 241 Vineyard Ridge Dr Unit 1
- 241 Vineyard Ridge Dr
- 681 Westmoreland Rd
- 239 Vineyard Ridge Dr
- 1063 Vineyard Rd
- 237 Vineyard Ridge Dr
- 237 Vineyard Ridge Dr
- 1061 Vineyard Rd
- 235 Vineyard Ridge Dr
- 235 Vineyard Rd
- 242 Vineyard Ridge Dr
- 1191 Vineyard Rd