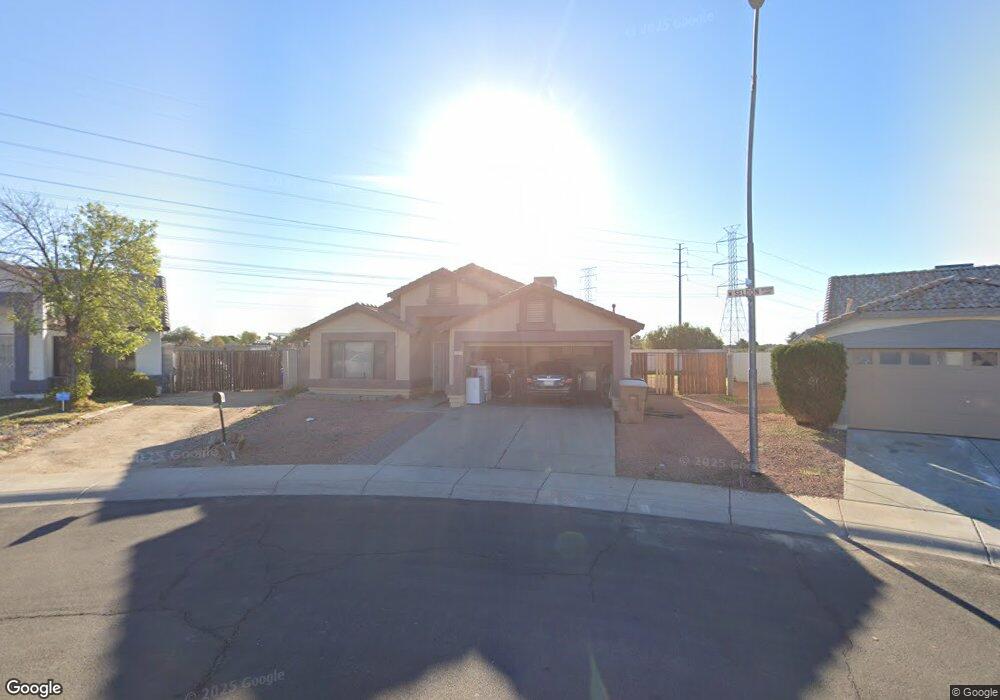
11231 W Seldon Ln Peoria, AZ 85345
Estimated Value: $369,905 - $415,000
3
Beds
2
Baths
1,644
Sq Ft
$236/Sq Ft
Est. Value
About This Home
This home is located at 11231 W Seldon Ln, Peoria, AZ 85345 and is currently estimated at $387,726, approximately $235 per square foot. 11231 W Seldon Ln is a home located in Maricopa County with nearby schools including Country Meadows Elementary School, Raymond S. Kellis, and Heritage Elementary School.
Ownership History
Date
Name
Owned For
Owner Type
Purchase Details
Closed on
Apr 27, 2011
Sold by
Barlow Anne Y
Bought by
Bartow Bruce D
Current Estimated Value
Purchase Details
Closed on
Apr 20, 2011
Sold by
U S Bank National Association
Bought by
Bartow Bruce D
Purchase Details
Closed on
Mar 23, 2011
Sold by
Parker Shannon D and Searns Marcie E
Bought by
U S Bank National Associatoin
Purchase Details
Closed on
May 26, 1999
Sold by
Diamond Key Homes Inc
Bought by
Parker Shannon D and Sears Marcie E
Home Financials for this Owner
Home Financials are based on the most recent Mortgage that was taken out on this home.
Original Mortgage
$104,978
Interest Rate
6.86%
Mortgage Type
FHA
Purchase Details
Closed on
Feb 5, 1999
Sold by
Stardust Development Inc
Bought by
Diamond Key Homes Inc
Create a Home Valuation Report for This Property
The Home Valuation Report is an in-depth analysis detailing your home's value as well as a comparison with similar homes in the area
Home Values in the Area
Average Home Value in this Area
Purchase History
| Date | Buyer | Sale Price | Title Company |
|---|---|---|---|
| Bartow Bruce D | -- | North American Title Company | |
| Bartow Bruce D | $69,900 | North American Title Company | |
| U S Bank National Associatoin | $73,600 | None Available | |
| Parker Shannon D | $105,139 | Security Title Agency | |
| Diamond Key Homes Inc | $14,815 | Security Title Agency |
Source: Public Records
Mortgage History
| Date | Status | Borrower | Loan Amount |
|---|---|---|---|
| Previous Owner | Parker Shannon D | $104,978 |
Source: Public Records
Tax History Compared to Growth
Tax History
| Year | Tax Paid | Tax Assessment Tax Assessment Total Assessment is a certain percentage of the fair market value that is determined by local assessors to be the total taxable value of land and additions on the property. | Land | Improvement |
|---|---|---|---|---|
| 2025 | $1,266 | $13,546 | -- | -- |
| 2024 | $1,242 | $12,901 | -- | -- |
| 2023 | $1,242 | $28,160 | $5,630 | $22,530 |
| 2022 | $1,217 | $21,670 | $4,330 | $17,340 |
| 2021 | $1,275 | $19,580 | $3,910 | $15,670 |
| 2020 | $1,283 | $18,200 | $3,640 | $14,560 |
| 2019 | $1,244 | $16,550 | $3,310 | $13,240 |
| 2018 | $1,207 | $15,350 | $3,070 | $12,280 |
| 2017 | $1,204 | $14,030 | $2,800 | $11,230 |
| 2016 | $1,190 | $13,260 | $2,650 | $10,610 |
| 2015 | $1,107 | $12,860 | $2,570 | $10,290 |
Source: Public Records
Map
Nearby Homes
- 8541 N 112th Ave
- 11211 W Lawrence Ln
- 8742 N 114th Ave
- 8566 N 108th Ln
- 11003 W Griswold Rd
- 8890 N 114th Ave
- 8893 N 114th Dr
- 8800 N 107th Ave Unit 17
- 8800 N 107th Ave Unit 19
- 10913 W Caron Dr
- 11005 W Kelso Dr
- 8140 N 107th Ave Unit 125
- 8140 N 107th Ave Unit 281
- 8140 N 107th Ave Unit 287
- 10825 W Caron Dr
- 9232 N 110th Ave
- 10625 W Alice Ave
- 10621 W Lawrence Ln
- 10603 W Ruth Ave
- 11536 W Green Dr
- 8521 N 112th Ave
- 11233 W Seldon Ln
- 11222 W Butler Dr
- 8523 N 112th Ave
- 11241 W Seldon Ln
- 8531 N 112th Ave
- 11243 W Seldon Ln
- 11204 W Butler Dr
- 11204 W Seldon Ln
- 11303 W Seldon Ln
- 8533 N 112th Ave
- 11202 W Butler Dr
- 11311 W Seldon Ln
- 11222 W Seldon Ln
- 11224 W Butler Dr
- 11242 W Seldon Ln
- 11313 W Seldon Ln
- 8543 N 112th Ave
- 11232 W Butler Dr
- 8544 N 112th Ave