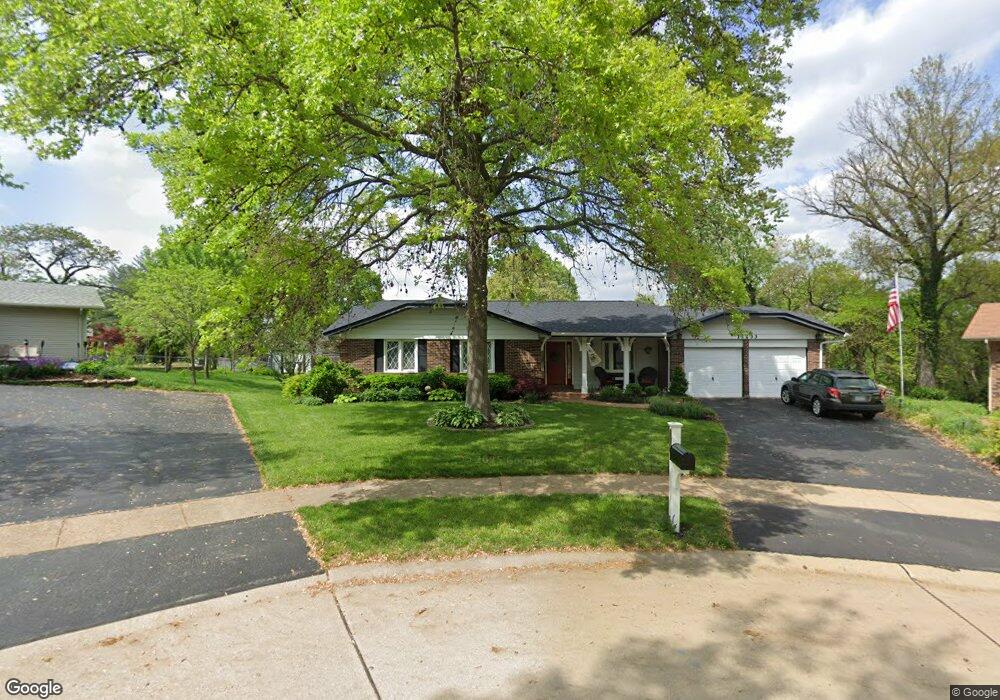
11233 Crested View Ct Saint Louis, MO 63146
Estimated Value: $341,314 - $393,000
3
Beds
3
Baths
1,773
Sq Ft
$212/Sq Ft
Est. Value
About This Home
This home is located at 11233 Crested View Ct, Saint Louis, MO 63146 and is currently estimated at $375,329, approximately $211 per square foot. 11233 Crested View Ct is a home located in St. Louis County with nearby schools including Willow Brook Elementary School, Pattonville Heights Middle School, and Pattonville High School.
Ownership History
Date
Name
Owned For
Owner Type
Purchase Details
Closed on
Oct 17, 2016
Sold by
Smith Lauren A and Blair Christopher M
Bought by
Smith Blair Lauren A and Blair Christopher M
Current Estimated Value
Home Financials for this Owner
Home Financials are based on the most recent Mortgage that was taken out on this home.
Original Mortgage
$200,000
Outstanding Balance
$93,667
Interest Rate
3.44%
Mortgage Type
New Conventional
Estimated Equity
$281,662
Purchase Details
Closed on
Jun 9, 2011
Sold by
Stankovich Craig M and Stankovich Deborah A
Bought by
Smith Lauren A
Home Financials for this Owner
Home Financials are based on the most recent Mortgage that was taken out on this home.
Original Mortgage
$214,423
Interest Rate
4.5%
Mortgage Type
FHA
Create a Home Valuation Report for This Property
The Home Valuation Report is an in-depth analysis detailing your home's value as well as a comparison with similar homes in the area
Home Values in the Area
Average Home Value in this Area
Purchase History
| Date | Buyer | Sale Price | Title Company |
|---|---|---|---|
| Smith Blair Lauren A | -- | Integrity Title Solutions Ll | |
| Smith Lauren A | $220,000 | None Available |
Source: Public Records
Mortgage History
| Date | Status | Borrower | Loan Amount |
|---|---|---|---|
| Open | Smith Blair Lauren A | $200,000 | |
| Closed | Smith Lauren A | $214,423 |
Source: Public Records
Tax History Compared to Growth
Tax History
| Year | Tax Paid | Tax Assessment Tax Assessment Total Assessment is a certain percentage of the fair market value that is determined by local assessors to be the total taxable value of land and additions on the property. | Land | Improvement |
|---|---|---|---|---|
| 2025 | $3,727 | $58,940 | $13,340 | $45,600 |
| 2024 | $3,727 | $53,160 | $8,000 | $45,160 |
| 2023 | $3,741 | $53,160 | $8,000 | $45,160 |
| 2022 | $3,620 | $46,820 | $10,680 | $36,140 |
| 2021 | $3,600 | $46,820 | $10,680 | $36,140 |
| 2020 | $3,513 | $43,870 | $11,570 | $32,300 |
| 2019 | $3,492 | $43,870 | $11,570 | $32,300 |
| 2018 | $3,499 | $40,320 | $10,680 | $29,640 |
| 2017 | $3,508 | $40,320 | $10,680 | $29,640 |
| 2016 | $3,508 | $39,560 | $9,790 | $29,770 |
| 2015 | $3,455 | $39,560 | $9,790 | $29,770 |
| 2014 | $3,698 | $41,990 | $7,140 | $34,850 |
Source: Public Records
Map
Nearby Homes
- 11017 Sandistan Dr
- 1060 Port Diane Dr
- 1462 Pine Row Ct
- 1480 Pine Row Ct
- 11263 Pineside Dr
- 1033 Wilton Royal Dr Unit 210
- 1033 Wilton Royal Dr Unit 107
- 1033 Wilton Royal Dr Unit 204
- 23 Country Squire Ln
- 50 Willow Brook Dr
- 1054 Willow Brook Dr
- 1279 Guelbreth Ln Unit 210
- 1251 Guelbreth Ln Unit 308
- 195 Sunny Wood Ct
- 10401 Briarbend Dr Unit 2
- 10469 Briarbend Dr Unit 3
- 18 Sona Ln
- 10387 Forest Brook Ln
- 866 Deaver Ln
- 10381 Oxford Hill Dr Unit 24
- 1144 Crested View Dr
- 11204 Sherwood Oak Ct
- 11230 Crested View Ct
- 11208 Sherwood Oak Ct
- 1148 Crested View Dr
- 11234 Crested View Ct
- 11212 Sherwood Oak Ct
- 1132 Crested View Dr
- 1152 Crested View Dr
- 1143 Crested View Dr
- 1139 Crested View Dr
- 1147 Crested View Dr
- 1135 Crested View Dr
- 11207 Sherwood Oak Ct
- 1187 Tennant Rd
- 11216 Sherwood Oak Ct
- 1128 Crested View Dr
- 1151 Crested View Dr
- 1156 Crested View Dr
- 11211 Sherwood Oak Ct