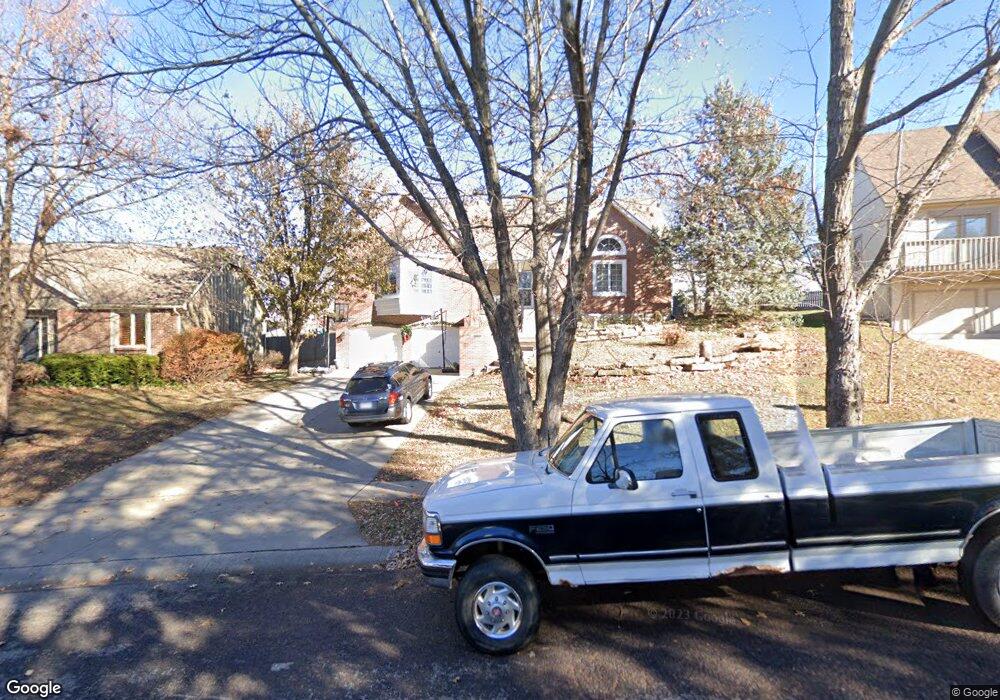
11239 Eby St Overland Park, KS 66210
Central Overland Park NeighborhoodEstimated Value: $451,000 - $502,431
4
Beds
5
Baths
2,481
Sq Ft
$194/Sq Ft
Est. Value
About This Home
This home is located at 11239 Eby St, Overland Park, KS 66210 and is currently estimated at $481,358, approximately $194 per square foot. 11239 Eby St is a home located in Johnson County with nearby schools including Indian Valley Elementary School, Oxford Middle, and Blue Valley Northwest High School.
Ownership History
Date
Name
Owned For
Owner Type
Purchase Details
Closed on
May 31, 2011
Sold by
Allenbrand Ryan N and Gustafson Courtney L
Bought by
Allenbrand Ryan N and Gustafson Courtney L
Current Estimated Value
Purchase Details
Closed on
Feb 17, 2011
Sold by
Gustafson Gilbert L
Bought by
Allenbrand Ryan N and Gustafson Courtney L
Home Financials for this Owner
Home Financials are based on the most recent Mortgage that was taken out on this home.
Original Mortgage
$204,000
Interest Rate
4.78%
Mortgage Type
New Conventional
Create a Home Valuation Report for This Property
The Home Valuation Report is an in-depth analysis detailing your home's value as well as a comparison with similar homes in the area
Home Values in the Area
Average Home Value in this Area
Purchase History
| Date | Buyer | Sale Price | Title Company |
|---|---|---|---|
| Allenbrand Ryan N | -- | None Available | |
| Allenbrand Ryan N | -- | Chicago Title Ins Co |
Source: Public Records
Mortgage History
| Date | Status | Borrower | Loan Amount |
|---|---|---|---|
| Closed | Allenbrand Ryan N | $204,000 |
Source: Public Records
Tax History
| Year | Tax Paid | Tax Assessment Tax Assessment Total Assessment is a certain percentage of the fair market value that is determined by local assessors to be the total taxable value of land and additions on the property. | Land | Improvement |
|---|---|---|---|---|
| 2025 | $5,102 | $53,463 | $11,324 | $42,139 |
| 2023 | $5,122 | $49,220 | $11,324 | $37,896 |
| 2022 | $4,717 | $44,539 | $11,324 | $33,215 |
| 2021 | $4,667 | $41,780 | $9,842 | $31,938 |
| 2020 | $4,589 | $40,813 | $8,557 | $32,256 |
| 2019 | $4,519 | $39,341 | $5,707 | $33,634 |
| 2018 | $4,098 | $37,329 | $5,707 | $31,622 |
| 2017 | $4,162 | $34,891 | $5,707 | $29,184 |
| 2016 | $3,890 | $32,591 | $5,707 | $26,884 |
| 2015 | $3,821 | $31,889 | $5,707 | $26,182 |
| 2013 | -- | $29,267 | $5,707 | $23,560 |
Source: Public Records
Map
Nearby Homes
- 11505 Grant Dr
- 9220 W 116th St
- 11408 Hemlock St
- 11606 Hemlock St
- 11262 Hadley St
- 11683 Grant Dr
- 11705 Grant St
- 9524 W 117th St
- 11505 Lowell Ave
- 11811 Slater St
- 8861 W 106th Terrace
- 7816 W 115th St
- 11301 Lowell Ave
- 11445 Lowell Ave
- 11721 Hemlock St
- 8822 W 106th Terrace Unit 13
- 7805 W 114th Terrace
- 8810 W 106th Terrace
- 11806 Craig St
- 9411 W 119th Terrace
Your Personal Tour Guide
Ask me questions while you tour the home.