Estimated Value: $116,000 - $158,407
Studio
--
Bath
1,120
Sq Ft
$124/Sq Ft
Est. Value
About This Home
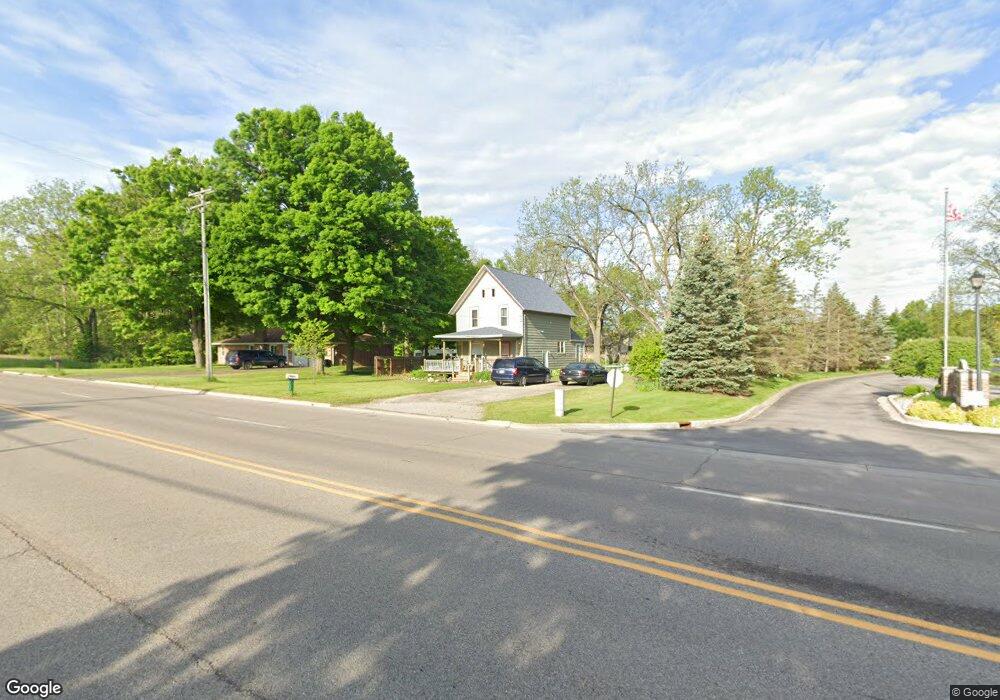
This home is located at 11239 N Clio Rd, Clio, MI 48420 and is currently estimated at $138,602, approximately $123 per square foot. 11239 N Clio Rd is a home located in Genesee County with nearby schools including George R. Carter Middle School and Clio Area High School.
Ownership History
Date
Name
Owned For
Owner Type
Purchase Details
Closed on
Jun 3, 2022
Sold by
Bone Vanessa A
Bought by
Bone Arthur
Current Estimated Value
Home Financials for this Owner
Home Financials are based on the most recent Mortgage that was taken out on this home.
Original Mortgage
$40,500
Outstanding Balance
$29,286
Interest Rate
5.27%
Mortgage Type
New Conventional
Estimated Equity
$109,316
Purchase Details
Closed on
May 8, 2019
Sold by
Bone Vanessa A
Bought by
Bone Arthur and Bone Vanessa A
Purchase Details
Closed on
Jan 23, 2007
Sold by
Campbell Frank and Campbell Sharon
Bought by
Sturdivant Anthony E and Sturdivant Kim M
Purchase Details
Closed on
Jul 29, 1999
Sold by
Dragory Andrew M
Bought by
Campbell Frank
Purchase Details
Closed on
Mar 15, 1999
Sold by
Boone Michael and Boone Veronica L
Bought by
Dragoy Andrew M
Create a Home Valuation Report for This Property
The Home Valuation Report is an in-depth analysis detailing your home's value as well as a comparison with similar homes in the area
Home Values in the Area
Average Home Value in this Area
Purchase History
| Date | Buyer | Sale Price | Title Company |
|---|---|---|---|
| Bone Arthur | -- | Vanguard Title | |
| Stacey Vanessa A | $62,000 | Vanguard Title | |
| Bone Arthur | -- | None Available | |
| Sturdivant Anthony E | $25,000 | None Available | |
| Campbell Frank | $35,500 | Cislo Title Company | |
| Dragoy Andrew M | $32,500 | Sargents Title Company Llc |
Source: Public Records
Mortgage History
| Date | Status | Borrower | Loan Amount |
|---|---|---|---|
| Open | Stacey Vanessa A | $40,500 | |
| Closed | Bone Arthur | $40,500 |
Source: Public Records
Tax History
| Year | Tax Paid | Tax Assessment Tax Assessment Total Assessment is a certain percentage of the fair market value that is determined by local assessors to be the total taxable value of land and additions on the property. | Land | Improvement |
|---|---|---|---|---|
| 2025 | $3,758 | $57,700 | $0 | $0 |
| 2024 | $1,228 | $53,500 | $0 | $0 |
| 2023 | $1,171 | $47,600 | $0 | $0 |
| 2022 | $2,913 | $43,800 | $0 | $0 |
| 2021 | $2,892 | $39,900 | $0 | $0 |
| 2020 | $662 | $39,100 | $0 | $0 |
| 2019 | $621 | $34,400 | $0 | $0 |
| 2018 | $2,417 | $29,800 | $0 | $0 |
| 2017 | $2,271 | $29,800 | $0 | $0 |
| 2016 | $2,224 | $27,900 | $0 | $0 |
| 2015 | $2,438 | $26,200 | $0 | $0 |
| 2012 | -- | $24,400 | $24,400 | $0 |
Source: Public Records
Map
Nearby Homes
- 801 S Mill St
- 713 S Mill St
- 655 Park View
- 3166 Quail Ridge Ct
- 3172 Quail Ridge Ct
- Elements 2070 Plan at Pheasant Run
- 11159 Pheasant Run Dr
- Integrity 1610 Plan at Pheasant Run
- Elements 1800 Plan at Pheasant Run
- Integrity 2061 V8.1a Plan at Pheasant Run
- Integrity 1830 Plan at Pheasant Run
- Elements 2700 Plan at Pheasant Run
- Elements 2090 Plan at Pheasant Run
- Elements 2200 Plan at Pheasant Run
- Integrity 2085 Plan at Pheasant Run
- Integrity 1605 Plan at Pheasant Run
- Integrity 1880 Plan at Pheasant Run
- Integrity 2080 Plan at Pheasant Run
- Integrity 2000 Plan at Pheasant Run
- Integrity 2190 Plan at Pheasant Run
- 11231 N Clio Rd
- 11253 N Clio Rd
- 3105 Rotterdam Dr Unit 80
- 3113 Rotterdam Dr Unit 78
- 3117 Rotterdam Dr Unit 77
- 11259 N Clio Rd
- 3100 Amsterdam Dr Unit 1
- 3104 Amsterdam Dr
- 11240 N Clio Rd
- 3118 Rotterdam Dr Unit 47
- 3121 Rotterdam Dr Unit 76
- 11265 N Clio Rd
- 3108 Amsterdam Dr Unit 3
- 3122 Rotterdam Dr Unit 48
- 11250 N Clio Rd
- 11258 Clio Rd
- 11232 N Clio Rd
- 3125 Rotterdam Dr Unit 75
- 3112 Amsterdam Dr Unit 4
- 3117 Amsterdam Dr