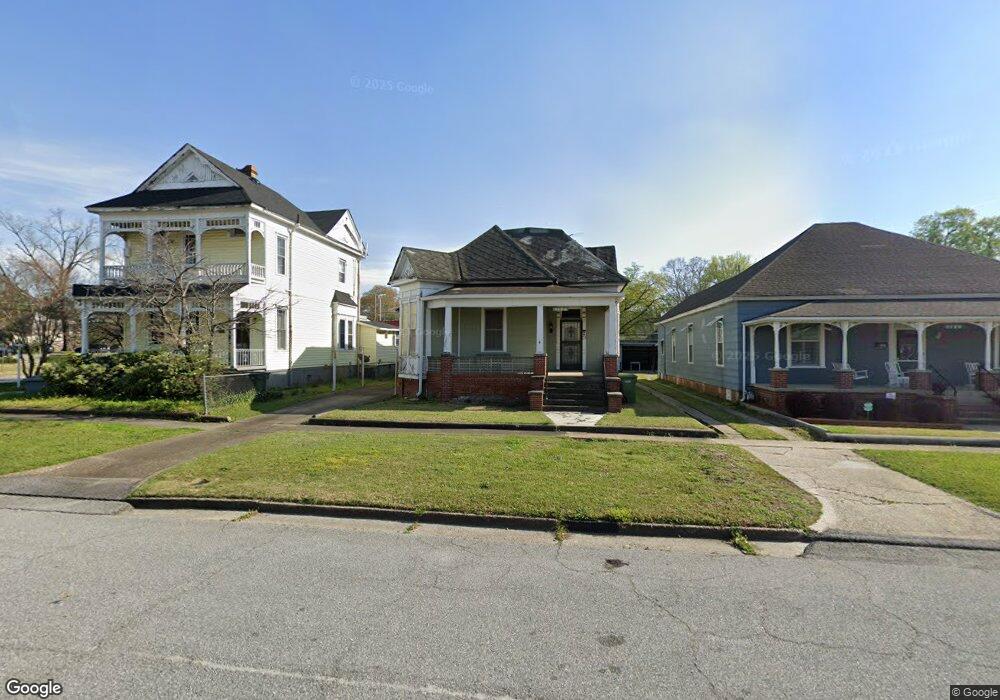
1124 19th St Columbus, GA 31901
East Highlands NeighborhoodEstimated Value: $149,000 - $207,477
3
Beds
3
Baths
2,541
Sq Ft
$69/Sq Ft
Est. Value
About This Home
This home is located at 1124 19th St, Columbus, GA 31901 and is currently estimated at $174,869, approximately $68 per square foot. 1124 19th St is a home located in Muscogee County with nearby schools including Richards Middle School, Jordan Vocational High School, and Wynnton Elementary School.
Ownership History
Date
Name
Owned For
Owner Type
Purchase Details
Closed on
Sep 14, 2007
Sold by
Pate Nellie Gilmer
Bought by
Conkle Howell W
Current Estimated Value
Purchase Details
Closed on
Aug 9, 2007
Sold by
Wood Victoria P
Bought by
Pate Nellie Gilmer
Purchase Details
Closed on
Aug 7, 2007
Sold by
Knight Arthur F
Bought by
Pate Nellie Gilmer
Purchase Details
Closed on
Aug 6, 2007
Sold by
Pate Perry E and Pate Donald F
Bought by
Pate Nellie Gilmer
Create a Home Valuation Report for This Property
The Home Valuation Report is an in-depth analysis detailing your home's value as well as a comparison with similar homes in the area
Home Values in the Area
Average Home Value in this Area
Purchase History
| Date | Buyer | Sale Price | Title Company |
|---|---|---|---|
| Conkle Howell W | $50,000 | None Available | |
| Pate Nellie Gilmer | -- | None Available | |
| Pate Nellie Gilmer | -- | None Available | |
| Pate Nellie Gilmer | -- | None Available | |
| Pate Nellie Gilmer | -- | None Available |
Source: Public Records
Tax History Compared to Growth
Tax History
| Year | Tax Paid | Tax Assessment Tax Assessment Total Assessment is a certain percentage of the fair market value that is determined by local assessors to be the total taxable value of land and additions on the property. | Land | Improvement |
|---|---|---|---|---|
| 2025 | $213 | $54,528 | $9,696 | $44,832 |
| 2024 | -- | $54,528 | $9,696 | $44,832 |
| 2023 | $1,753 | $54,528 | $9,696 | $44,832 |
| 2022 | $1,753 | $42,924 | $9,696 | $33,228 |
| 2021 | $1,264 | $30,964 | $9,696 | $21,268 |
| 2020 | $1,265 | $30,964 | $9,696 | $21,268 |
| 2019 | $1,269 | $30,964 | $9,696 | $21,268 |
| 2018 | $1,084 | $31,124 | $9,696 | $21,428 |
| 2017 | $1,279 | $31,124 | $9,696 | $21,428 |
| 2016 | $703 | $17,049 | $2,600 | $14,449 |
| 2015 | $282 | $17,049 | $2,600 | $14,449 |
| 2014 | $705 | $17,049 | $2,600 | $14,449 |
| 2013 | $706 | $17,049 | $2,600 | $14,449 |
Source: Public Records
Map
Nearby Homes