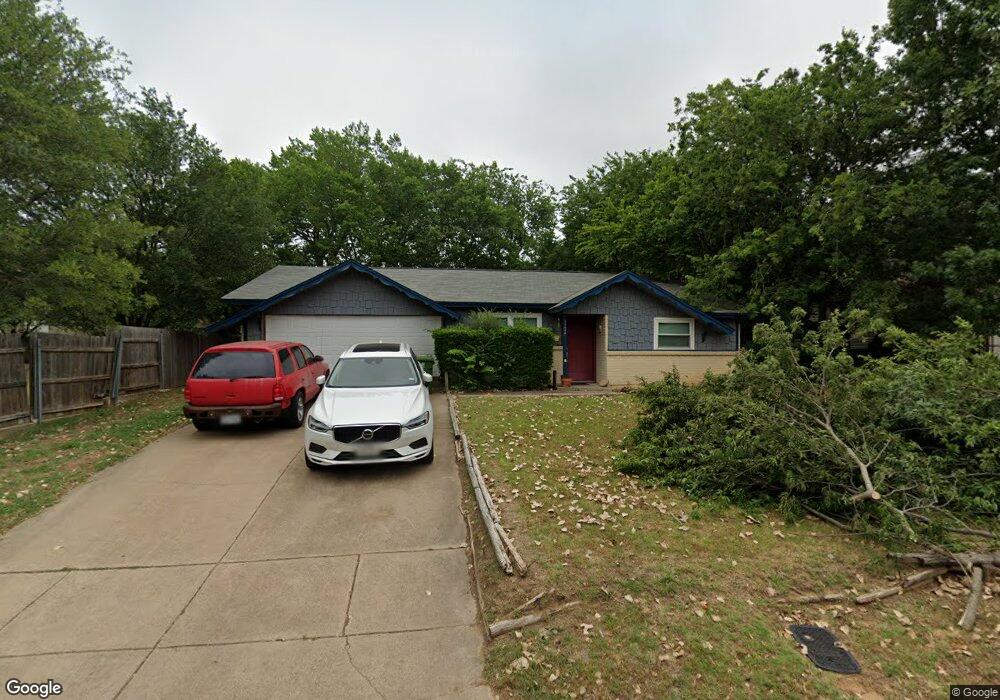
1124 Belle St Bedford, TX 76022
Estimated Value: $226,000 - $280,000
3
Beds
2
Baths
1,291
Sq Ft
$200/Sq Ft
Est. Value
About This Home
This home is located at 1124 Belle St, Bedford, TX 76022 and is currently estimated at $257,796, approximately $199 per square foot. 1124 Belle St is a home located in Tarrant County with nearby schools including Stonegate Elementary School, Hurst J High School, and L.D. Bell High School.
Ownership History
Date
Name
Owned For
Owner Type
Purchase Details
Closed on
Sep 8, 2025
Sold by
Lopez Ridvia and Lopez Eduardo M
Bought by
Lopez Ridvia
Current Estimated Value
Purchase Details
Closed on
Mar 10, 2006
Sold by
Dicapo Laura
Bought by
Lopez Eduardo M and Lopez Ridvia
Home Financials for this Owner
Home Financials are based on the most recent Mortgage that was taken out on this home.
Original Mortgage
$93,263
Interest Rate
6.19%
Mortgage Type
FHA
Purchase Details
Closed on
Jun 5, 2002
Sold by
Dicapo Brenda Sue
Bought by
Dicapo Laura
Home Financials for this Owner
Home Financials are based on the most recent Mortgage that was taken out on this home.
Original Mortgage
$67,200
Interest Rate
6.77%
Purchase Details
Closed on
May 19, 1999
Sold by
Lietgeb Michele Suzanne and Dicapo Michael Charles
Bought by
Dicapo Brenda Sue
Create a Home Valuation Report for This Property
The Home Valuation Report is an in-depth analysis detailing your home's value as well as a comparison with similar homes in the area
Home Values in the Area
Average Home Value in this Area
Purchase History
| Date | Buyer | Sale Price | Title Company |
|---|---|---|---|
| Lopez Ridvia | -- | None Listed On Document | |
| Lopez Eduardo M | -- | Commonwealth Land | |
| Dicapo Laura | -- | Metroplex Title Co | |
| Dicapo Brenda Sue | -- | -- |
Source: Public Records
Mortgage History
| Date | Status | Borrower | Loan Amount |
|---|---|---|---|
| Previous Owner | Lopez Eduardo M | $93,263 | |
| Previous Owner | Dicapo Laura | $67,200 |
Source: Public Records
Tax History Compared to Growth
Tax History
| Year | Tax Paid | Tax Assessment Tax Assessment Total Assessment is a certain percentage of the fair market value that is determined by local assessors to be the total taxable value of land and additions on the property. | Land | Improvement |
|---|---|---|---|---|
| 2025 | $2,114 | $198,000 | $55,000 | $143,000 |
| 2024 | $2,114 | $214,858 | $55,000 | $159,858 |
| 2023 | $2,920 | $216,425 | $35,000 | $181,425 |
| 2022 | $3,023 | $192,153 | $35,000 | $157,153 |
| 2021 | $2,964 | $143,000 | $35,000 | $108,000 |
| 2020 | $2,720 | $150,660 | $35,000 | $115,660 |
| 2019 | $2,527 | $104,000 | $35,000 | $69,000 |
| 2018 | $2,145 | $104,000 | $16,000 | $88,000 |
| 2017 | $2,324 | $131,319 | $16,000 | $115,319 |
| 2016 | $2,113 | $107,365 | $16,000 | $91,365 |
| 2015 | $1,719 | $79,400 | $15,000 | $64,400 |
| 2014 | $1,719 | $79,400 | $15,000 | $64,400 |
Source: Public Records
Map
Nearby Homes
- 1220 Norwood Dr
- 116 Oakhurst Dr
- 1136 Simpson Dr
- 1348 Norwood Dr
- 1352 Simpson Dr
- 1337 Harrison Ln
- 905 Brown Trail
- 344 Bedford Ct E
- 113 Sunnyvale Terrace
- 341 Hurst Dr
- 409 Vicki Place
- 1236 King Dr
- 1008 Russell Ln
- 420 Bedford Ct W
- 1016 Keith Dr
- 49 Coffee Tavern Rd
- 802 Brown Trail
- 803 Glenda Dr
- 501 Merrill Dr
- 849 Russell Ln
- 1120 Belle St
- 1116 Belle St
- 1125 Belle St
- 1117 Belle St
- 1112 Belle St
- 112 Bedford Rd
- 1113 Belle St
- 1108 Belle St
- 1212 Valley View Ct
- 1216 Valley View Ct
- 1208 Valley View Ct
- 1220 Valley View Ct
- 1104 Belle St
- 1200 Valley View Ct
- 1105 Belle St
- 1100 Belle St
- 1101 Belle St
- 1168 Valley View Dr
- 1164 Valley View Dr
- 1213 Valley View Ct