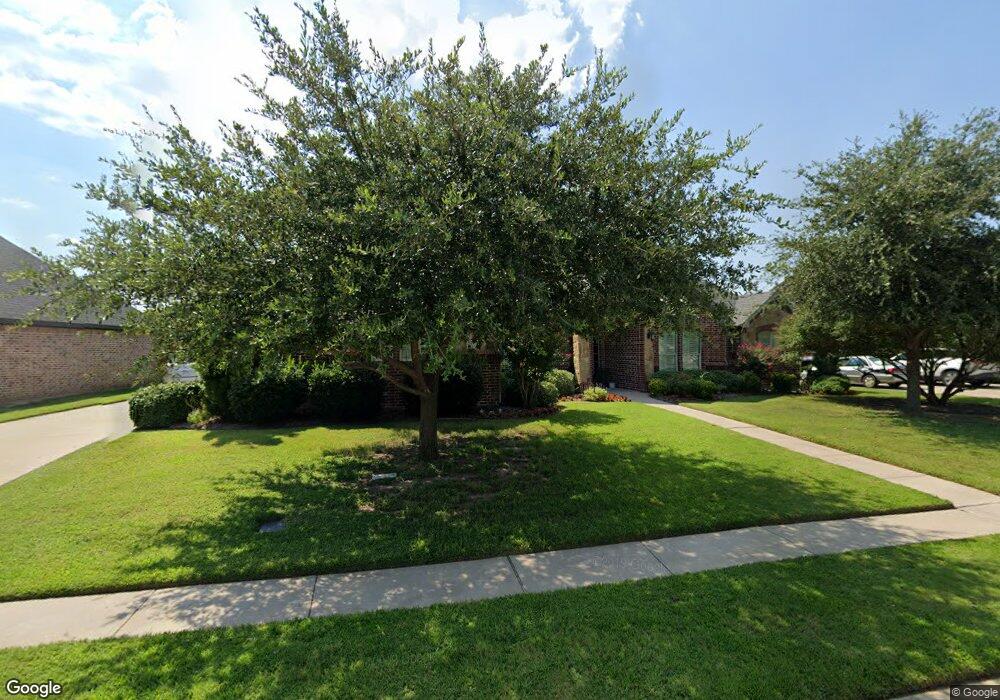
1124 Fountain Creek Blvd Pottsboro, TX 75076
Estimated Value: $419,024 - $573,000
3
Beds
3
Baths
2,332
Sq Ft
$213/Sq Ft
Est. Value
About This Home
This home is located at 1124 Fountain Creek Blvd, Pottsboro, TX 75076 and is currently estimated at $496,012, approximately $212 per square foot. 1124 Fountain Creek Blvd is a home located in Grayson County with nearby schools including Pottsboro Elementary School, Pottsboro Middle School, and Pottsboro High School.
Ownership History
Date
Name
Owned For
Owner Type
Purchase Details
Closed on
Sep 29, 2011
Sold by
Fountain Creek Estates Llc
Bought by
Poe Jack Vernon and Poe Wanda B
Current Estimated Value
Home Financials for this Owner
Home Financials are based on the most recent Mortgage that was taken out on this home.
Original Mortgage
$46,700
Outstanding Balance
$4,242
Interest Rate
3.46%
Mortgage Type
Future Advance Clause Open End Mortgage
Estimated Equity
$491,770
Purchase Details
Closed on
Mar 8, 2006
Sold by
Ceci Bates Investments Inc
Bought by
Poe Jack and Poe Wanda
Purchase Details
Closed on
Oct 19, 2004
Sold by
Fountain Creek Estates Llc
Bought by
Ceci Bates Investments Inc
Home Financials for this Owner
Home Financials are based on the most recent Mortgage that was taken out on this home.
Original Mortgage
$194,511
Interest Rate
5.82%
Mortgage Type
Purchase Money Mortgage
Create a Home Valuation Report for This Property
The Home Valuation Report is an in-depth analysis detailing your home's value as well as a comparison with similar homes in the area
Home Values in the Area
Average Home Value in this Area
Purchase History
| Date | Buyer | Sale Price | Title Company |
|---|---|---|---|
| Poe Jack Vernon | -- | Red River Title Co | |
| Poe Jack | -- | Red River Title Co | |
| Ceci Bates Investments Inc | -- | -- |
Source: Public Records
Mortgage History
| Date | Status | Borrower | Loan Amount |
|---|---|---|---|
| Open | Poe Jack Vernon | $46,700 | |
| Previous Owner | Ceci Bates Investments Inc | $194,511 |
Source: Public Records
Tax History Compared to Growth
Tax History
| Year | Tax Paid | Tax Assessment Tax Assessment Total Assessment is a certain percentage of the fair market value that is determined by local assessors to be the total taxable value of land and additions on the property. | Land | Improvement |
|---|---|---|---|---|
| 2025 | -- | $460,722 | $69,047 | $391,675 |
| 2024 | $8,459 | $438,319 | $0 | $0 |
| 2023 | $8,443 | $398,472 | $0 | $0 |
| 2022 | $7,675 | $362,247 | $0 | $0 |
| 2021 | $7,304 | $329,315 | $38,923 | $290,392 |
| 2020 | $6,934 | $302,571 | $28,380 | $274,191 |
| 2019 | $7,321 | $305,061 | $28,380 | $276,681 |
| 2018 | $6,721 | $277,504 | $28,380 | $249,124 |
| 2017 | $6,277 | $256,101 | $20,897 | $235,204 |
| 2016 | $6,338 | $258,592 | $20,897 | $237,695 |
| 2015 | $4,268 | $252,006 | $20,897 | $231,109 |
| 2014 | $4,386 | $241,001 | $20,897 | $220,104 |
Source: Public Records
Map
Nearby Homes
- 1026 Addison Ave
- 1016 Fountain Creek Blvd
- 1131 Fountain Creek Blvd
- 1023 Teagan Ct
- 2033 Nichole Blvd
- 20 AC Preston Bend Rd
- 49 AC Preston Bend Rd
- 3.269 Ac Sh 289
- 133 S Meadowbrook Dr
- 3.269 AC Texas 289
- 705 Texas 289
- 297 Cemetery Rd
- 118 Texoma Meadows
- 107 Fountain Meadows
- 200 Clement Ct
- 113 Rock Hill Rd
- 101 Rock Hill Rd
- TBD Pearce Dr
- 111 Prairie Meadow Ln
- 106 Kristy Ct
- 1122 Fountain Creek Blvd
- 1126 Fountain Creek Blvd
- 1025 Addison Ave
- 2201 Fountain Creek
- 1128 Fountain Creek Blvd
- 1029 Addison Ave
- 2201 Fountain Creek Blvd
- 1120 Fountain Creek Blvd
- 1023 Addison Ave
- 2015 Payton Way
- 2019 Payton Way
- 1130 Fountain Creek Blvd
- 1031 Addison Ave
- 1018 Fountain Creek Blvd
- 2001 Nichol Blvd
- 1021 Addison Ave
- 1024 Addison Ave
- 1033 Addison Ave
- 1028 Addison Ave
- 1014 Fountain Creek Blvd