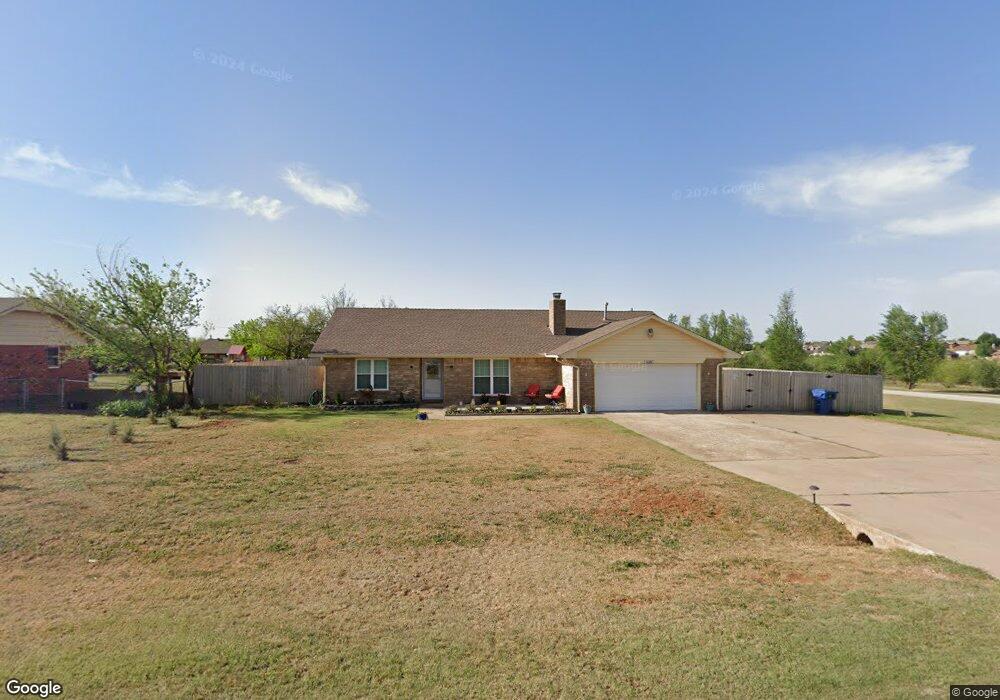
1124 Harrison Ave NW Piedmont, OK 73078
Estimated Value: $224,000 - $257,000
3
Beds
2
Baths
1,588
Sq Ft
$152/Sq Ft
Est. Value
About This Home
This home is located at 1124 Harrison Ave NW, Piedmont, OK 73078 and is currently estimated at $241,893, approximately $152 per square foot. 1124 Harrison Ave NW is a home located in Canadian County with nearby schools including Piedmont Elementary School, Piedmont Middle School, and Piedmont Intermediate Elementary School.
Ownership History
Date
Name
Owned For
Owner Type
Purchase Details
Closed on
Apr 18, 2023
Sold by
Baker Aaron John
Bought by
Bunker Energy Llc
Current Estimated Value
Purchase Details
Closed on
Apr 23, 2021
Sold by
Butler Pamelia G and Evelyn L Mcintyre Property Tru
Bought by
Blank John A and Blank Toni
Home Financials for this Owner
Home Financials are based on the most recent Mortgage that was taken out on this home.
Original Mortgage
$153,600
Interest Rate
3%
Mortgage Type
New Conventional
Purchase Details
Closed on
Jan 2, 2015
Sold by
Mcintyre Evely L
Bought by
Butler Pamelia G and Evelyn L Mcintyre Property Trust
Purchase Details
Closed on
Oct 15, 2014
Sold by
Mcintyre Evelyn L
Bought by
Butler Pamelia G and The Evelyn L Mcintyre Property Trust
Purchase Details
Closed on
May 4, 2001
Sold by
Lowe Timothy E and Lowe Carol A
Purchase Details
Closed on
Oct 12, 1995
Sold by
Curttright Jerry B and Curttright Evelyn
Purchase Details
Closed on
Sep 8, 1992
Sold by
Fowler Errol and Fowler Avis
Create a Home Valuation Report for This Property
The Home Valuation Report is an in-depth analysis detailing your home's value as well as a comparison with similar homes in the area
Home Values in the Area
Average Home Value in this Area
Purchase History
| Date | Buyer | Sale Price | Title Company |
|---|---|---|---|
| Bunker Energy Llc | $9,500 | None Listed On Document | |
| Blank John A | $192,000 | Chicago Title Oklahoma Co | |
| Butler Pamelia G | -- | None Available | |
| Butler Pamelia G | -- | None Available | |
| -- | $103,000 | -- | |
| -- | $84,000 | -- | |
| -- | $67,400 | -- |
Source: Public Records
Mortgage History
| Date | Status | Borrower | Loan Amount |
|---|---|---|---|
| Previous Owner | Blank John A | $153,600 |
Source: Public Records
Tax History Compared to Growth
Tax History
| Year | Tax Paid | Tax Assessment Tax Assessment Total Assessment is a certain percentage of the fair market value that is determined by local assessors to be the total taxable value of land and additions on the property. | Land | Improvement |
|---|---|---|---|---|
| 2024 | $1,824 | $18,019 | $2,400 | $15,619 |
| 2023 | $1,824 | $17,161 | $2,400 | $14,761 |
| 2022 | $1,754 | $16,344 | $2,400 | $13,944 |
| 2021 | $1,651 | $14,851 | $2,305 | $12,546 |
| 2020 | $1,600 | $14,144 | $2,260 | $11,884 |
| 2019 | $1,448 | $13,470 | $2,220 | $11,250 |
| 2018 | $1,397 | $12,828 | $2,182 | $10,646 |
| 2017 | $1,325 | $12,217 | $2,131 | $10,086 |
| 2016 | $1,218 | $12,218 | $2,138 | $10,080 |
| 2015 | -- | $11,082 | $2,035 | $9,047 |
| 2014 | -- | $11,082 | $1,983 | $9,099 |
Source: Public Records
Map
Nearby Homes
- 1123 Van Buren Ave NW
- 14028 Babbling Brook Dr
- 601 Van Buren Ave NW
- 0 NW Jackson Ave Unit 1155243
- 414 Harrison Ave NW
- 1227 Stout Dr NW
- 410 Taylor Ave NW
- 220 Jackson Ave NW
- 0 NW 178th St Unit 1180705
- 2005 Oak Cir
- 736 Cypress St NW
- 211 Madison Ave NE
- 2625 Washington Ave W
- 2267 Poplar Ave
- 1090 Auburn Cir
- 1245 Mahogany Ln
- 1223 Mahogany Ln
- 201 Cypress St NW
- 415 Washington Ave E
- 1391 Hickory Trail
- 1112 Harrison Ave NW
- 1109 Harrison Ave NW
- 1104 Harrison Ave NW
- 1111 Van Buren Ave NW
- 1105 Harrison Ave NW
- 1020 Harrison Ave NW
- 1103 Van Buren Ave NW
- 1017 Harrison Ave NW
- 1126 Tyler Ave NW
- 1114 Tyler Ave NW
- 1122 Van Buren Ave NW
- 1110 Van Buren Ave NW
- 1015 Van Buren Ave NW
- 1013 Harrison Ave NW
- 1106 Tyler Ave NW Unit NW
- 1102 Van Buren Ave NW
- 1125 Tyler Ave NW
- 1113 Tyler Ave NW
- 1018 Tyler Ave NW
- 1005 Van Buren Ave NW