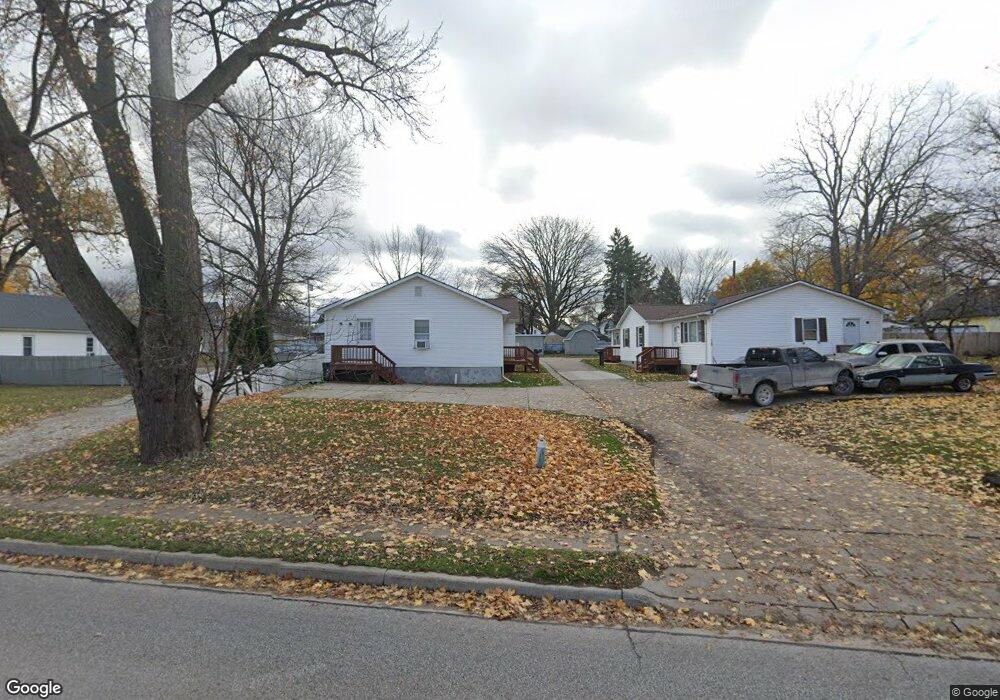
1124 Lapeer Ave Port Huron, MI 48060
Estimated Value: $154,312 - $172,000
6
Beds
2
Baths
2,150
Sq Ft
$77/Sq Ft
Est. Value
About This Home
This home is located at 1124 Lapeer Ave, Port Huron, MI 48060 and is currently estimated at $164,828, approximately $76 per square foot. 1124 Lapeer Ave is a home located in St. Clair County with nearby schools including Woodrow Wilson Elementary School, Central Middle School, and Port Huron High School.
Ownership History
Date
Name
Owned For
Owner Type
Purchase Details
Closed on
Apr 28, 2022
Sold by
Element Assets Llc
Bought by
Carlson Steven
Current Estimated Value
Home Financials for this Owner
Home Financials are based on the most recent Mortgage that was taken out on this home.
Original Mortgage
$103,125
Outstanding Balance
$97,834
Interest Rate
5.1%
Mortgage Type
New Conventional
Estimated Equity
$66,994
Purchase Details
Closed on
Aug 13, 2015
Sold by
Myers Ward and Myers Kim
Bought by
Federal Home Loan Mortgage Corporation
Purchase Details
Closed on
Jun 21, 2007
Sold by
Sabb George and Sabb Mary Kay
Bought by
Wells Fargo Bank Na
Create a Home Valuation Report for This Property
The Home Valuation Report is an in-depth analysis detailing your home's value as well as a comparison with similar homes in the area
Home Values in the Area
Average Home Value in this Area
Purchase History
| Date | Buyer | Sale Price | Title Company |
|---|---|---|---|
| Carlson Steven | $137,500 | Liberty Title | |
| Federal Home Loan Mortgage Corporation | $10,902 | Attorney | |
| Wells Fargo Bank Na | $106,155 | None Available |
Source: Public Records
Mortgage History
| Date | Status | Borrower | Loan Amount |
|---|---|---|---|
| Open | Carlson Steven | $103,125 |
Source: Public Records
Tax History Compared to Growth
Tax History
| Year | Tax Paid | Tax Assessment Tax Assessment Total Assessment is a certain percentage of the fair market value that is determined by local assessors to be the total taxable value of land and additions on the property. | Land | Improvement |
|---|---|---|---|---|
| 2025 | $4,511 | $78,500 | $0 | $0 |
| 2024 | $4,083 | $74,300 | $0 | $0 |
| 2023 | $3,867 | $66,600 | $0 | $0 |
| 2022 | $2,282 | $52,800 | $0 | $0 |
| 2021 | $2,178 | $49,600 | $0 | $0 |
| 2020 | $2,187 | $43,400 | $43,400 | $0 |
| 2019 | $2,148 | $32,200 | $0 | $0 |
| 2018 | $2,099 | $32,200 | $0 | $0 |
| 2017 | $1,927 | $40,900 | $0 | $0 |
| 2016 | $2,129 | $40,900 | $0 | $0 |
| 2015 | $2,089 | $40,000 | $40,000 | $0 |
| 2014 | $2,089 | $38,800 | $38,800 | $0 |
| 2013 | -- | $39,100 | $0 | $0 |
Source: Public Records
Map
Nearby Homes
- 702 12th St Unit 704
- 1118 Lapeer Ave
- 714 12th St
- 1130 Lapeer Ave
- 718 12th St
- 722 12th St
- 1117 Gillett St
- 1108 Lapeer Ave
- 1202/1204 Lapeer Ave
- 1100 Lapeer Ave
- 1115 Lapeer Ave
- 1123 Lapeer Ave
- 709 11th St
- 1202 Lapeer Ave
- 1127 Lapeer Ave
- 1115 Gillett St
- 1109 Lapeer Ave
- 1103 Lapeer Ave
- 717 11th St
- 1133 Lapeer Ave