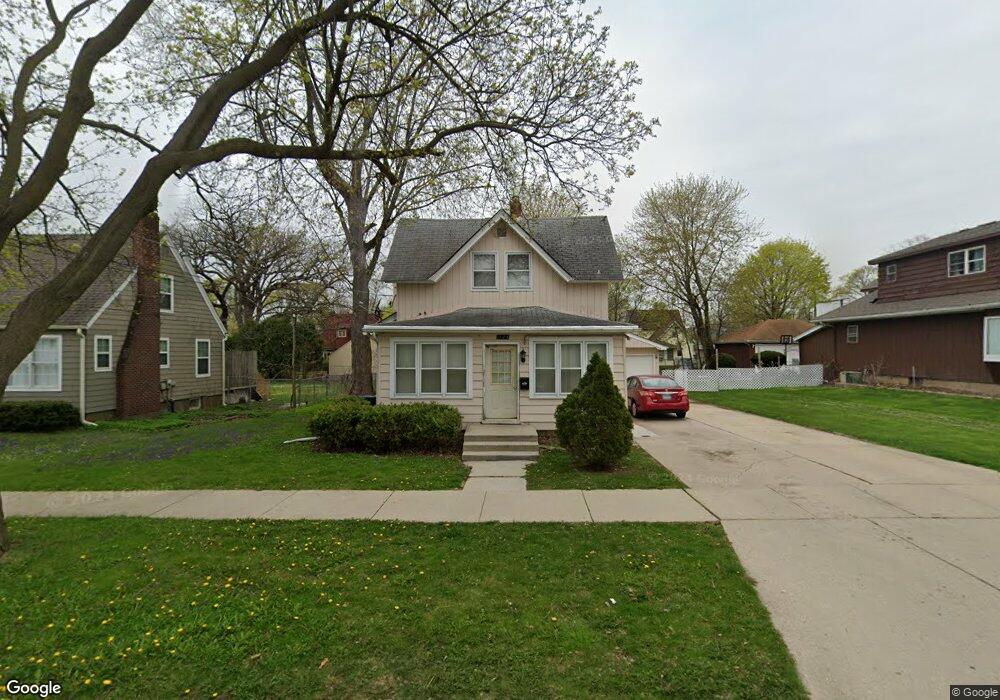
1124 Morton Ave Elgin, IL 60120
Northeast Elgin NeighborhoodEstimated Value: $301,000 - $336,000
4
Beds
2
Baths
1,702
Sq Ft
$186/Sq Ft
Est. Value
About This Home
This home is located at 1124 Morton Ave, Elgin, IL 60120 and is currently estimated at $316,376, approximately $185 per square foot. 1124 Morton Ave is a home located in Kane County with nearby schools including Coleman Elementary School, Larsen Middle School, and Elgin High School.
Ownership History
Date
Name
Owned For
Owner Type
Purchase Details
Closed on
Aug 14, 2013
Sold by
Diaz Litvana and Romero Litvana
Bought by
Romero Litvana
Current Estimated Value
Home Financials for this Owner
Home Financials are based on the most recent Mortgage that was taken out on this home.
Original Mortgage
$156,000
Outstanding Balance
$114,750
Interest Rate
4.12%
Mortgage Type
New Conventional
Estimated Equity
$201,626
Purchase Details
Closed on
May 12, 2009
Sold by
Diaz Litvana and Diaz Romeo
Bought by
Diaz Litvana
Purchase Details
Closed on
Sep 27, 2005
Sold by
Diaz Litvana and Romero Leonardo
Bought by
Diaz Romeo and Diaz Litvana
Purchase Details
Closed on
Feb 24, 2005
Sold by
Romero Leonardo and Diaz Litvana
Bought by
Romero Leonardo and Diaz Litvana
Purchase Details
Closed on
Jan 31, 2003
Sold by
Wahl Clara and Wahl Clyde
Bought by
Romero Leonardo and Diaz Litvana
Home Financials for this Owner
Home Financials are based on the most recent Mortgage that was taken out on this home.
Original Mortgage
$160,481
Interest Rate
5.87%
Mortgage Type
FHA
Create a Home Valuation Report for This Property
The Home Valuation Report is an in-depth analysis detailing your home's value as well as a comparison with similar homes in the area
Home Values in the Area
Average Home Value in this Area
Purchase History
| Date | Buyer | Sale Price | Title Company |
|---|---|---|---|
| Romero Litvana | -- | None Available | |
| Diaz Litvana | -- | None Available | |
| Diaz Romeo | -- | -- | |
| Romero Leonardo | -- | -- | |
| Romero Leonardo | $165,000 | -- |
Source: Public Records
Mortgage History
| Date | Status | Borrower | Loan Amount |
|---|---|---|---|
| Open | Romero Litvana | $156,000 | |
| Previous Owner | Romero Leonardo | $160,481 |
Source: Public Records
Tax History Compared to Growth
Tax History
| Year | Tax Paid | Tax Assessment Tax Assessment Total Assessment is a certain percentage of the fair market value that is determined by local assessors to be the total taxable value of land and additions on the property. | Land | Improvement |
|---|---|---|---|---|
| 2024 | $4,907 | $93,862 | $18,868 | $74,994 |
| 2023 | $5,227 | $84,797 | $17,046 | $67,751 |
| 2022 | $6,184 | $77,320 | $15,543 | $61,777 |
| 2021 | $5,914 | $72,289 | $14,532 | $57,757 |
| 2020 | $5,747 | $69,011 | $13,873 | $55,138 |
| 2019 | $5,579 | $65,737 | $13,215 | $52,522 |
| 2018 | $5,391 | $60,528 | $12,449 | $48,079 |
| 2017 | $5,268 | $57,221 | $11,769 | $45,452 |
| 2016 | $5,022 | $53,085 | $10,918 | $42,167 |
| 2015 | -- | $48,657 | $10,007 | $38,650 |
| 2014 | -- | $48,056 | $9,883 | $38,173 |
| 2013 | -- | $49,324 | $10,144 | $39,180 |
Source: Public Records
Map
Nearby Homes
- 909 Bellevue Ave
- 1152 Hiawatha Dr
- 1409 Dundee Ave
- 1167 Candida Rd Unit 532
- 633 Slade Ave
- 1181 Hiawatha Dr
- 1116 Candlewood Rd Unit 356
- 82 Northshore Rd Unit 491
- 72 Parkwood Rd Unit 464
- 1101 Lakewood Rd
- 117 Parkwood Rd
- 130 Parkwood Rd Unit 456
- 939 Prospect St
- 1210 Mohawk Dr
- 221 Little Peninsula Rd Unit 313
- 118 Melbrooke Rd Unit 615
- 115 Tollview Rd
- 241 Little Peninsula Rd
- 805 Augusta Ave
- 668 Hill Ave
- 1132 Morton Ave
- 1122 Morton Ave
- 521 River Bluff Rd
- 1133 Hill Ave
- 505 River Bluff Rd
- 1106 Morton Ave
- 1127 Morton Ave
- 1135 Morton Ave
- 1121 Morton Ave
- 1137 Morton Ave
- 1109 Hill Ave
- 1115 Morton Ave
- 522 River Bluff Rd
- 1104 Morton Ave
- 535 River Bluff Rd
- 502 Congdon Ave
- 499 River Bluff Rd
- 530 River Bluff Rd
- 1101 Morton Ave
- 1160 Morton Ave