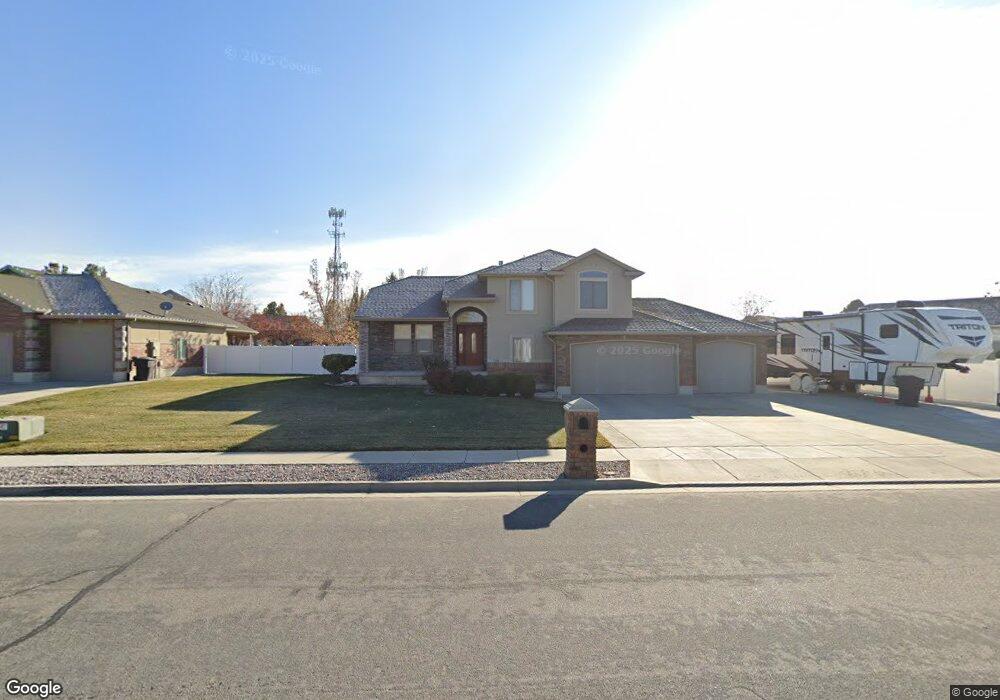
1124 N 2220 W Unit 29 Clearfield, UT 84015
Estimated Value: $562,116 - $700,000
3
Beds
3
Baths
1,905
Sq Ft
$333/Sq Ft
Est. Value
About This Home
This home is located at 1124 N 2220 W Unit 29, Clearfield, UT 84015 and is currently estimated at $633,779, approximately $332 per square foot. 1124 N 2220 W Unit 29 is a home located in Davis County with nearby schools including Lakeside School, West Point Junior High School, and Syracuse High School.
Ownership History
Date
Name
Owned For
Owner Type
Purchase Details
Closed on
Jul 21, 2005
Sold by
Falk Michael and Falk Kathleen
Bought by
Shapiro Stephen
Current Estimated Value
Home Financials for this Owner
Home Financials are based on the most recent Mortgage that was taken out on this home.
Original Mortgage
$77,000
Outstanding Balance
$39,805
Interest Rate
5.51%
Mortgage Type
Fannie Mae Freddie Mac
Estimated Equity
$593,974
Purchase Details
Closed on
Dec 12, 2002
Sold by
Falk Mike and Falk Kathleen
Bought by
Falk Michael and Falk Kathleen
Home Financials for this Owner
Home Financials are based on the most recent Mortgage that was taken out on this home.
Original Mortgage
$145,000
Interest Rate
4.87%
Purchase Details
Closed on
Apr 18, 2002
Sold by
Clinton Fields Lc
Bought by
Falk Mike and Falk Kathleen
Create a Home Valuation Report for This Property
The Home Valuation Report is an in-depth analysis detailing your home's value as well as a comparison with similar homes in the area
Home Values in the Area
Average Home Value in this Area
Purchase History
| Date | Buyer | Sale Price | Title Company |
|---|---|---|---|
| Shapiro Stephen | -- | Equity Title Ins Agency Inc | |
| Falk Michael | -- | Mountain View Title & Escrow | |
| Falk Mike | -- | Heritage West Title Insuranc |
Source: Public Records
Mortgage History
| Date | Status | Borrower | Loan Amount |
|---|---|---|---|
| Open | Shapiro Stephen | $77,000 | |
| Previous Owner | Falk Michael | $145,000 |
Source: Public Records
Tax History Compared to Growth
Tax History
| Year | Tax Paid | Tax Assessment Tax Assessment Total Assessment is a certain percentage of the fair market value that is determined by local assessors to be the total taxable value of land and additions on the property. | Land | Improvement |
|---|---|---|---|---|
| 2025 | $2,940 | $282,700 | $111,973 | $170,727 |
| 2024 | $2,982 | $288,200 | $120,634 | $167,566 |
| 2023 | $2,796 | $500,000 | $141,566 | $358,434 |
| 2022 | $2,974 | $294,250 | $81,400 | $212,850 |
| 2021 | $2,725 | $400,000 | $110,787 | $289,213 |
| 2020 | $2,362 | $343,000 | $99,171 | $243,829 |
| 2019 | $2,340 | $332,000 | $106,697 | $225,303 |
| 2018 | $2,231 | $311,000 | $88,978 | $222,022 |
| 2016 | $1,991 | $143,330 | $33,708 | $109,622 |
| 2015 | $1,969 | $134,750 | $33,708 | $101,042 |
| 2014 | $1,569 | $109,092 | $33,708 | $75,384 |
| 2013 | -- | $131,941 | $32,883 | $99,058 |
Source: Public Records
Map
Nearby Homes
- 1124 N 2220 W
- 1136 N 2220 W
- 2178 W 1080 N
- 2204 W 1080 N
- 2153 W 1145 N
- 2153 W 1145 N Unit 27
- 2156 W 1080 N
- 1149 N 2220 W
- 1149 N 2220 W Unit 43
- 1133 N 2220 W
- 1133 N 2220 W Unit 42
- 1121 N 2220 W
- 1107 N 2220 W
- 1107 N 2220 W Unit 40
- 2182 W 1145 N Unit 23
- 2137 W 1145 N
- 2137 W 1145 N Unit 26
- 2187 W 1080 N
- 2187 W 1080 N Unit 36
- 2158 W 1145 N