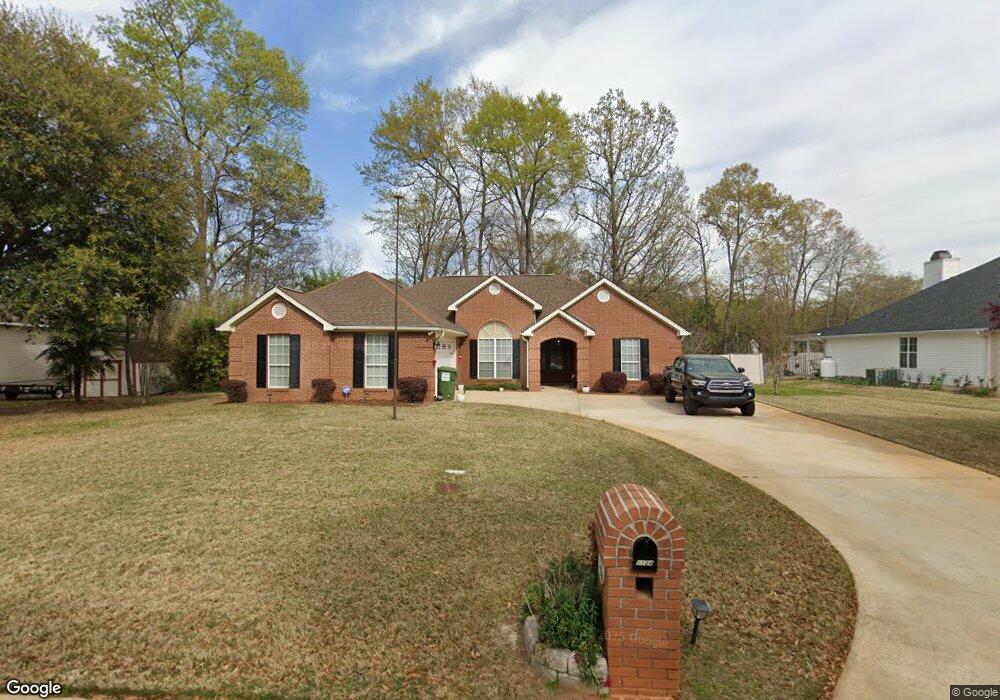
1124 Panola Cir Warner Robins, GA 31088
Estimated Value: $256,000 - $263,000
3
Beds
2
Baths
1,620
Sq Ft
$159/Sq Ft
Est. Value
About This Home
This home is located at 1124 Panola Cir, Warner Robins, GA 31088 and is currently estimated at $257,947, approximately $159 per square foot. 1124 Panola Cir is a home located in Houston County with nearby schools including Lake Joy Primary School, Lake Joy Elementary School, and Feagin Mill Middle School.
Ownership History
Date
Name
Owned For
Owner Type
Purchase Details
Closed on
Aug 9, 2019
Sold by
Boday David Adam
Bought by
Varga Derek A
Current Estimated Value
Home Financials for this Owner
Home Financials are based on the most recent Mortgage that was taken out on this home.
Original Mortgage
$114,400
Outstanding Balance
$100,255
Interest Rate
3.73%
Mortgage Type
New Conventional
Estimated Equity
$157,692
Purchase Details
Closed on
Jun 19, 2014
Sold by
Boday Ronald Walter
Bought by
Boday David Adam
Purchase Details
Closed on
May 24, 2000
Sold by
Rodriguez Kathleen M
Bought by
Boday Ronald W and Boday Elizabeth
Purchase Details
Closed on
Sep 20, 1996
Sold by
Russell Homes Inc
Bought by
Rodriguez Kathleen M
Purchase Details
Closed on
May 5, 1994
Sold by
Russell Richard L and Russell Odus S
Bought by
Russell Homes Inc
Create a Home Valuation Report for This Property
The Home Valuation Report is an in-depth analysis detailing your home's value as well as a comparison with similar homes in the area
Home Values in the Area
Average Home Value in this Area
Purchase History
| Date | Buyer | Sale Price | Title Company |
|---|---|---|---|
| Varga Derek A | $169,900 | None Available | |
| Boday David Adam | -- | -- | |
| Boday Ronald W | $124,000 | -- | |
| Rodriguez Kathleen M | $120,400 | -- | |
| Russell Homes Inc | -- | -- |
Source: Public Records
Mortgage History
| Date | Status | Borrower | Loan Amount |
|---|---|---|---|
| Open | Varga Derek A | $114,400 |
Source: Public Records
Tax History Compared to Growth
Tax History
| Year | Tax Paid | Tax Assessment Tax Assessment Total Assessment is a certain percentage of the fair market value that is determined by local assessors to be the total taxable value of land and additions on the property. | Land | Improvement |
|---|---|---|---|---|
| 2024 | $2,222 | $92,880 | $9,600 | $83,280 |
| 2023 | $2,059 | $85,200 | $9,000 | $76,200 |
| 2022 | $1,895 | $78,400 | $9,000 | $69,400 |
| 2021 | $1,549 | $63,760 | $9,000 | $54,760 |
| 2020 | $1,556 | $63,760 | $9,000 | $54,760 |
| 2019 | $1,299 | $53,200 | $9,000 | $44,200 |
| 2018 | $1,299 | $53,200 | $9,000 | $44,200 |
| 2017 | $1,300 | $53,200 | $9,000 | $44,200 |
| 2016 | $1,302 | $53,200 | $9,000 | $44,200 |
| 2015 | $1,322 | $53,920 | $9,000 | $44,920 |
| 2014 | -- | $53,920 | $9,000 | $44,920 |
| 2013 | -- | $53,920 | $9,000 | $44,920 |
Source: Public Records
Map
Nearby Homes
- 118 Great Oak Way
- 102 Stonemill Dr
- 104 Trotters Ct
- 115 Settlers Trail
- 900 Bay Laurel Cir
- 113 Carriage Run
- 1613 Sweetwater Dr
- 600 Bay Laurel Cir
- 0 Feagin Mill Rd Unit 10572748
- 0 Feagin Mill Rd Unit 254957
- 0 Feagin Mill Rd Unit 180689
- 113 Jana Ct
- 230 Tucker Rd
- 214 Westbury Ct
- 1120 Kathryn Ryals Rd
- 99 Bass Rd
- 310 Creek Ridge Dr
- 105 Green Meadow Dr
- 102 Meadow Ct
- 1120 Panola Cir
- 1128 Panola Cir
- 1116 Panola Cir
- 1121 Panola Cir
- 1125 Panola Cir
- 1140 Alderly Ln
- 1132 Panola Cir
- 1117 Panola Cir
- 1129 Panola Cir
- 1112 Panola Cir
- 1113 Panola Cir
- 1135 Alderly Ln
- 1136 Panola Cir
- 1209 Settlers Trail
- 1135 Panola Cir
- 1138 Alderly Ln
- 1208 Settlers Trail
- 1109 Panola Cir
- 1108 Panola Cir
- 1140 Panola Cir