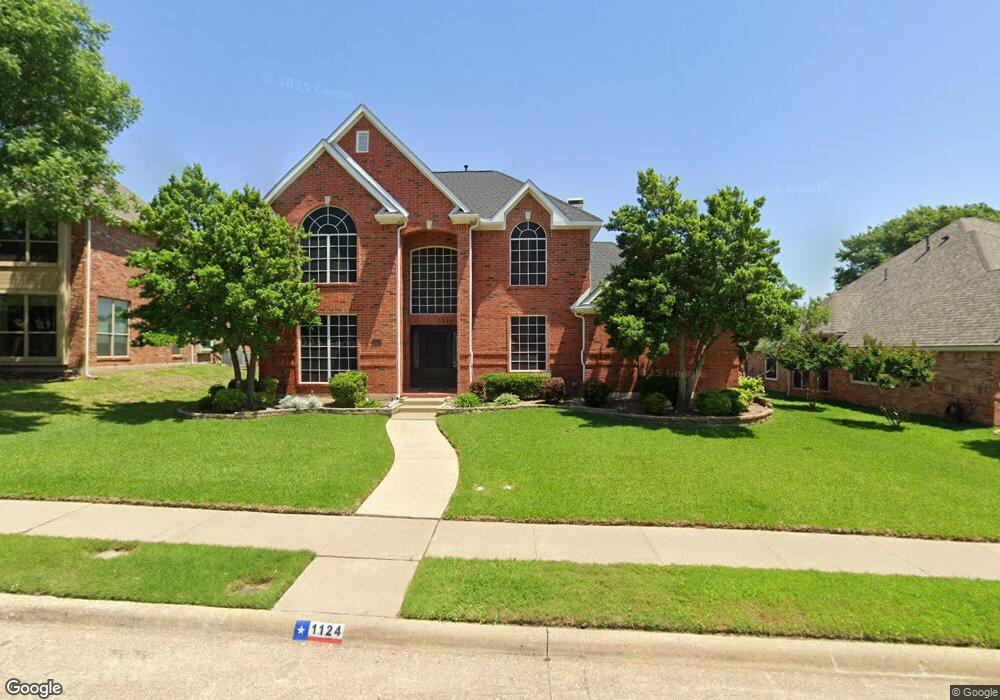
1124 Shadetree Ln Allen, TX 75013
Twin Creeks NeighborhoodEstimated Value: $622,182 - $760,000
4
Beds
3
Baths
2,785
Sq Ft
$239/Sq Ft
Est. Value
About This Home
This home is located at 1124 Shadetree Ln, Allen, TX 75013 and is currently estimated at $665,046, approximately $238 per square foot. 1124 Shadetree Ln is a home located in Collin County with nearby schools including Dr. E.T. Boon Elementary School, Ereckson Middle School, and Lowery Freshman Center.
Ownership History
Date
Name
Owned For
Owner Type
Purchase Details
Closed on
Apr 27, 2006
Sold by
Arana Julio C and Arana Anna Lisa P
Bought by
Bills Tony K and Matassa Ramona Lisa
Current Estimated Value
Home Financials for this Owner
Home Financials are based on the most recent Mortgage that was taken out on this home.
Original Mortgage
$198,000
Interest Rate
6.36%
Mortgage Type
Fannie Mae Freddie Mac
Purchase Details
Closed on
Aug 12, 1998
Sold by
Rhoades Gary D and Rhoades Holly H
Bought by
Arana Julio C and Arana Anna Lisa P
Home Financials for this Owner
Home Financials are based on the most recent Mortgage that was taken out on this home.
Original Mortgage
$175,750
Interest Rate
6.95%
Purchase Details
Closed on
Jun 28, 1995
Sold by
Nm Homes Corp
Bought by
Rhoades Gary D and Rhoades Holly H
Home Financials for this Owner
Home Financials are based on the most recent Mortgage that was taken out on this home.
Original Mortgage
$120,000
Interest Rate
7.77%
Create a Home Valuation Report for This Property
The Home Valuation Report is an in-depth analysis detailing your home's value as well as a comparison with similar homes in the area
Home Values in the Area
Average Home Value in this Area
Purchase History
| Date | Buyer | Sale Price | Title Company |
|---|---|---|---|
| Bills Tony K | -- | Ctic | |
| Arana Julio C | -- | -- | |
| Rhoades Gary D | -- | -- |
Source: Public Records
Mortgage History
| Date | Status | Borrower | Loan Amount |
|---|---|---|---|
| Closed | Bills Tony K | $198,000 | |
| Previous Owner | Arana Julio C | $175,750 | |
| Previous Owner | Rhoades Gary D | $120,000 |
Source: Public Records
Tax History Compared to Growth
Tax History
| Year | Tax Paid | Tax Assessment Tax Assessment Total Assessment is a certain percentage of the fair market value that is determined by local assessors to be the total taxable value of land and additions on the property. | Land | Improvement |
|---|---|---|---|---|
| 2025 | $7,333 | $568,075 | $150,000 | $445,198 |
| 2024 | $7,333 | $516,432 | $150,000 | $421,847 |
| 2023 | $7,333 | $469,484 | $125,000 | $454,979 |
| 2022 | $8,473 | $426,804 | $110,000 | $404,787 |
| 2021 | $8,249 | $388,004 | $95,000 | $293,004 |
| 2020 | $8,259 | $374,703 | $85,000 | $289,703 |
| 2019 | $8,801 | $381,000 | $85,000 | $296,000 |
| 2018 | $8,496 | $361,231 | $85,000 | $276,231 |
| 2017 | $8,068 | $343,000 | $85,000 | $258,000 |
| 2016 | $7,655 | $337,813 | $75,000 | $262,813 |
| 2015 | $6,510 | $290,000 | $65,000 | $225,000 |
Source: Public Records
Map
Nearby Homes
- 1123 Shadetree Ln
- 1210 Edgewood Ln
- 604 Pilot Point Dr
- 505 Cutter Ln
- 321 Phoebe Dr
- 112 Brentwood Ct
- 1208 Granger Dr
- 1038 Audrey Way
- 1029 Audrey Way
- 1101 Fairfax Dr
- 1013 Taylor Dr
- 1017 Lucy Ln
- 1013 Lucy Ln
- 1205 Sonoma Dr
- 1400 Cool Springs Dr
- 1411 Brandon Ct
- 1212 Cordova Dr
- 102 Fontana Ct
- 321 Beacon Hill Dr
- 1306 Granger Dr
- 1122 Shadetree Ln
- 1126 Shadetree Ln
- 500 Overhill Dr
- 1120 Shadetree Ln
- 503 Saginaw Ct
- 502 Overhill Dr
- 1200 Shadetree Ln
- 1121 Shadetree Ln
- 1125 Shadetree Ln
- 1118 Shadetree Ln
- 501 Saginaw Ct
- 1119 Shadetree Ln
- 504 Overhill Dr
- 1201 Shadetree Ln
- 1203 Wills Point Dr
- 1202 Shadetree Ln
- 1116 Shadetree Ln
- 505 Saginaw Ct
- 1200 Wills Point Dr
- 1117 Shadetree Ln