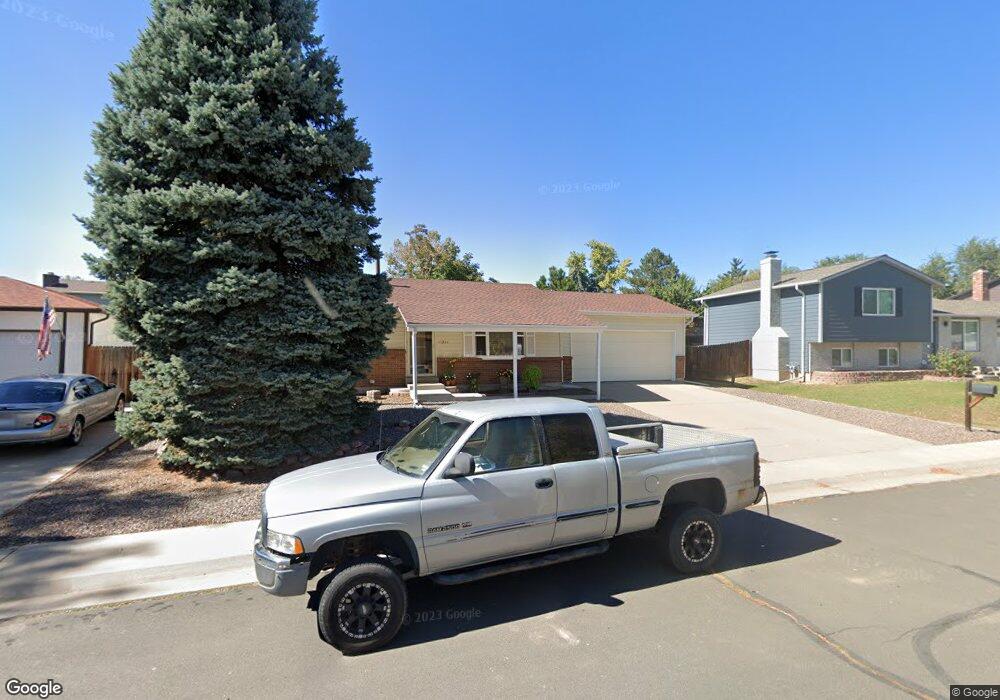
11241 Clermont Dr Thornton, CO 80233
Woodglen NeighborhoodEstimated Value: $379,000 - $467,000
2
Beds
2
Baths
816
Sq Ft
$511/Sq Ft
Est. Value
About This Home
This home is located at 11241 Clermont Dr, Thornton, CO 80233 and is currently estimated at $416,668, approximately $510 per square foot. 11241 Clermont Dr is a home located in Adams County with nearby schools including Cherry Drive Elementary School, Shadow Ridge Middle School, and Mountain Range High School.
Ownership History
Date
Name
Owned For
Owner Type
Purchase Details
Closed on
May 15, 2013
Sold by
Colorado Housing & Finance Authority
Bought by
Therrell Karen
Current Estimated Value
Home Financials for this Owner
Home Financials are based on the most recent Mortgage that was taken out on this home.
Original Mortgage
$133,860
Outstanding Balance
$94,726
Interest Rate
3.45%
Mortgage Type
New Conventional
Estimated Equity
$321,942
Purchase Details
Closed on
Jan 30, 2013
Sold by
Braun Cory L and Walker Jamielee K
Bought by
Colorado Housing & Finance Authority
Purchase Details
Closed on
Apr 5, 2007
Sold by
Hoppe Gerald L and Hoppe Linda C
Bought by
Walker Jamielee K and Braun Cory L
Home Financials for this Owner
Home Financials are based on the most recent Mortgage that was taken out on this home.
Original Mortgage
$155,750
Interest Rate
6.19%
Mortgage Type
Unknown
Purchase Details
Closed on
Oct 30, 1998
Sold by
Towne Duane S
Bought by
Hoppe Gerald L and Hoppe Linda C
Create a Home Valuation Report for This Property
The Home Valuation Report is an in-depth analysis detailing your home's value as well as a comparison with similar homes in the area
Home Values in the Area
Average Home Value in this Area
Purchase History
| Date | Buyer | Sale Price | Title Company |
|---|---|---|---|
| Therrell Karen | $138,001 | Fidelity National Title Insu | |
| Colorado Housing & Finance Authority | -- | None Available | |
| Walker Jamielee K | $160,500 | Security Title | |
| Hoppe Gerald L | $106,500 | -- |
Source: Public Records
Mortgage History
| Date | Status | Borrower | Loan Amount |
|---|---|---|---|
| Open | Therrell Karen | $133,860 | |
| Previous Owner | Walker Jamielee K | $155,750 |
Source: Public Records
Tax History Compared to Growth
Tax History
| Year | Tax Paid | Tax Assessment Tax Assessment Total Assessment is a certain percentage of the fair market value that is determined by local assessors to be the total taxable value of land and additions on the property. | Land | Improvement |
|---|---|---|---|---|
| 2024 | $1,821 | $24,380 | $6,130 | $18,250 |
| 2023 | $2,495 | $28,080 | $6,090 | $21,990 |
| 2022 | $2,238 | $20,320 | $6,190 | $14,130 |
| 2021 | $2,312 | $20,320 | $6,190 | $14,130 |
| 2020 | $2,230 | $19,990 | $6,360 | $13,630 |
| 2019 | $2,235 | $19,990 | $6,360 | $13,630 |
| 2018 | $1,742 | $15,140 | $6,120 | $9,020 |
| 2017 | $1,584 | $15,140 | $6,120 | $9,020 |
| 2016 | $1,156 | $10,760 | $3,340 | $7,420 |
| 2015 | $1,155 | $10,760 | $3,340 | $7,420 |
| 2014 | -- | $9,700 | $2,710 | $6,990 |
Source: Public Records
Map
Nearby Homes
- 4520 E 112th Place
- 4346 E 113th Place
- 11135 Clermont Dr
- 3916 E 113th Ave
- 5055 E 112th Ct
- 5056 E 112th Ct
- 4807 E 110th Place
- 10992 Albion Cir
- 11171 Forest Ave
- 4993 E 111th Place
- 11068 Eudora Cir
- 5303 E 113th Place
- 11062 Fairfax Cir
- 10895 Fairfax Way
- 11343 Grape Cir
- 11546 Monroe Way
- 3880 E 117th Ave
- 11279 Holly St
- 10985 Glencoe Place
- 4355 E 118th Ave
- 11235 Clermont Dr
- 11245 Clermont Dr
- 11286 Birch St
- 11296 Birch St
- 11276 Birch St
- 11251 Clermont Dr
- 11316 Birch St
- 11244 Clermont Dr
- 11238 Clermont Dr
- 11248 Clermont Dr
- 11266 Birch St
- 11255 Clermont Dr
- 11326 Birch St
- 11234 Clermont Dr
- 11254 Clermont Dr
- 11299 Birch St
- 11289 Birch St
- 11319 Birch St
- 11279 Birch St
- 11258 Clermont Dr