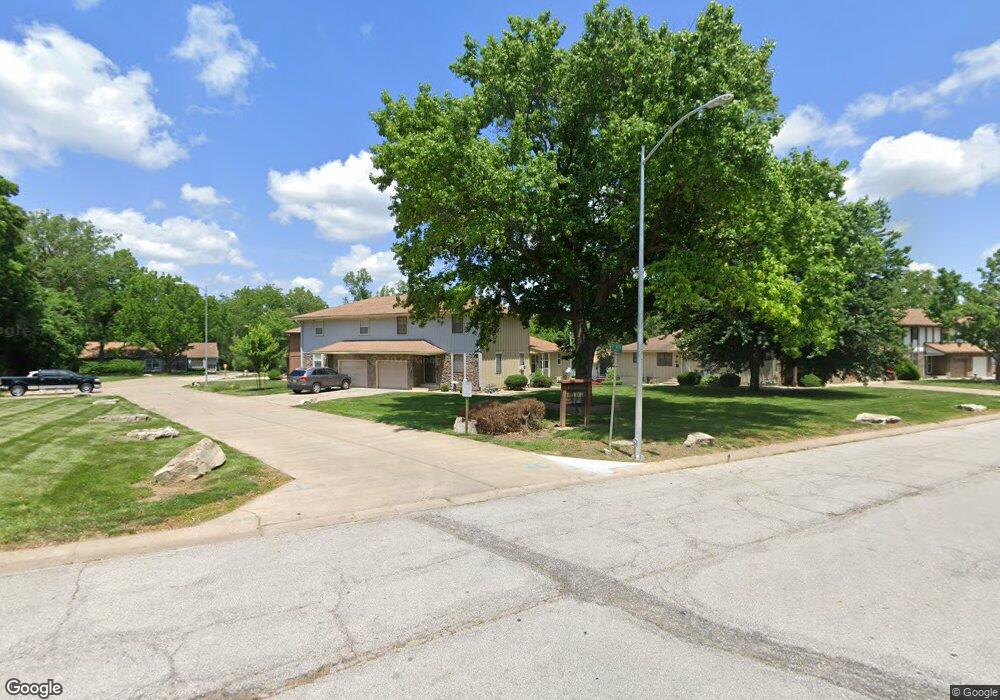
11244 E 71st Terrace Raytown, MO 64133
Estimated Value: $121,000 - $141,833
About This Home
This home is located at 11244 E 71st Terrace, Raytown, MO 64133 and is currently estimated at $132,208, approximately $147 per square foot. 11244 E 71st Terrace is a home located in Jackson County with nearby schools including Robinson Elementary School and Raytown Central Middle School.
Ownership History
We collect this data history from publicly available records. To have your information removed, we recommend requesting removal directly through your county’s website.
Purchase Details
Purchase Details
Purchase Details
Purchase Details
Home Financials for this Owner
Home Financials are based on the most recent Mortgage that was taken out on this home.Purchase Details
Home Financials for this Owner
Home Financials are based on the most recent Mortgage that was taken out on this home.Home Values in the Area
Average Home Value in this Area
Purchase History
We collect this data history from publicly available records. To have your information removed, we recommend requesting removal directly through your county’s website.
| Date | Buyer | Sale Price | Title Company |
|---|---|---|---|
| -- | None Listed On Document | ||
| -- | None Listed On Document | ||
| -- | First American Title | ||
| -- | First American Title Ins Co | ||
| -- | Ati Title Company | ||
| -- | -- |
Mortgage History
We collect this data history from publicly available records. To have your information removed, we recommend requesting removal directly through your county’s website.
| Date | Status | Borrower | Loan Amount |
|---|---|---|---|
| Previous Owner | $50,702 | ||
| Previous Owner | $46,523 |
Tax History
We collect this data history from publicly available records. To have your information removed, we recommend requesting removal directly through your county’s website.
| Year | Tax Paid | Tax Assessment Tax Assessment Total Assessment is a certain percentage of the fair market value that is determined by local assessors to be the total taxable value of land and additions on the property. | Land | Improvement |
|---|---|---|---|---|
| 2025 | $1,502 | $18,343 | $3,922 | $14,421 |
| 2024 | $1,492 | $16,648 | $467 | $16,181 |
| 2023 | $1,492 | $16,648 | $338 | $16,310 |
| 2022 | $1,305 | $13,870 | $447 | $13,423 |
| 2021 | $1,309 | $13,870 | $447 | $13,423 |
| 2020 | $1,159 | $12,161 | $447 | $11,714 |
| 2019 | $1,153 | $12,161 | $447 | $11,714 |
| 2018 | $933 | $10,193 | $994 | $9,199 |
| 2017 | $933 | $10,193 | $994 | $9,199 |
| 2016 | $904 | $9,937 | $950 | $8,987 |
| 2014 | $914 | $9,937 | $950 | $8,987 |
Map
- 11301 E 71st St
- 11709 E 71st Ct
- 11012 E 74th St
- 11533 E 74th Street Ct
- 10709 E 70th Terrace
- 6832 Sterling Ave
- 6828 Vermont Ave
- 6820 Wildwood Dr
- 11422 E 75th St
- 6817 Englewood Ave
- 7413 Hedges Ave
- 11708 E 75th St
- 7420 Hardy Ave
- 6807 Lakeshore Dr
- 10012 E 72nd St
- 7206 Larson Ave
- 11709 E 77th Terrace
- 10101 E 69th St
- 7204 Raytown Rd
- 9905 E 71st Terrace
- 11242 E 71st Dr Unit 2
- 11242 E 71st Dr
- 11242 E 71st Terrace
- 11244 E 71st Dr
- 11240 E 71st Dr
- 11240 E 71st Terrace
- 11238 E 71st Dr
- 11238 E 71st Terrace
- 11218 E 71st Dr
- 11218 E 71st Dr
- 11246 E 71st Terrace
- 11246 E 71st Dr
- 11248 E 71st Terrace
- 11252 E 71st Terrace
- 11212 E 71st Dr
- 11250 E 71st Terrace
- 11210 E 71st Dr
- 11206 E 71st Dr
- 11256 E 71st Terrace
- 11208 E 71st Dr
Ask me questions while you tour the home.