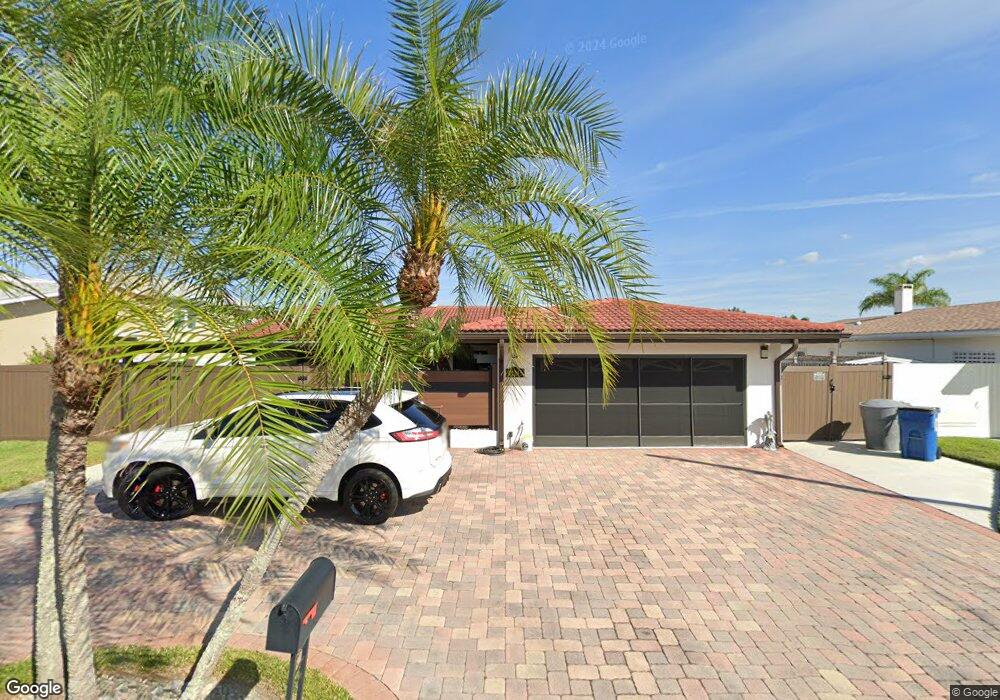
11245 5th St E Treasure Island, FL 33706
Estimated Value: $748,369 - $957,000
Studio
--
Bath
1,787
Sq Ft
$484/Sq Ft
Est. Value
About This Home
This home is located at 11245 5th St E, Treasure Island, FL 33706 and is currently estimated at $865,592, approximately $484 per square foot. 11245 5th St E is a home with nearby schools including Azalea Elementary School, Azalea Middle School, and Boca Ciega High School.
Ownership History
Date
Name
Owned For
Owner Type
Purchase Details
Closed on
Sep 1, 2016
Bought by
Bonnell Timothy A Living Trus
Current Estimated Value
Purchase Details
Closed on
Jun 10, 2016
Sold by
Douglas Jona F
Bought by
Bonnell Timothy A
Purchase Details
Closed on
Dec 2, 2009
Sold by
Douglas Jona F and Douglas George A
Bought by
Douglas Jona F and Douglas George A
Purchase Details
Closed on
Apr 2, 2003
Sold by
Douglas Jona F
Bought by
Douglas George A
Purchase Details
Closed on
Mar 3, 1997
Sold by
Douglas George A
Bought by
Douglas George A and Douglas Jona F
Create a Home Valuation Report for This Property
The Home Valuation Report is an in-depth analysis detailing your home's value as well as a comparison with similar homes in the area
Home Values in the Area
Average Home Value in this Area
Purchase History
| Date | Buyer | Sale Price | Title Company |
|---|---|---|---|
| Bonnell Timothy A Living Trus | -- | -- | |
| Bonnell Timothy A | $200,000 | Somers Title Co | |
| Douglas Jona F | -- | Attorney | |
| Douglas George A | -- | -- | |
| Douglas George A | -- | -- | |
| Douglas George A | -- | -- |
Source: Public Records
Mortgage History
| Date | Status | Borrower | Loan Amount |
|---|---|---|---|
| Previous Owner | Douglas George A | $75,000 |
Source: Public Records
Tax History
| Year | Tax Paid | Tax Assessment Tax Assessment Total Assessment is a certain percentage of the fair market value that is determined by local assessors to be the total taxable value of land and additions on the property. | Land | Improvement |
|---|---|---|---|---|
| 2025 | $13,969 | $610,412 | $560,651 | $49,761 |
| 2024 | $13,805 | $906,389 | -- | -- |
| 2023 | $13,805 | $879,989 | $0 | $0 |
| 2022 | $13,477 | $854,358 | $719,084 | $135,274 |
| 2021 | $10,171 | $583,565 | $0 | $0 |
| 2020 | $9,627 | $550,279 | $0 | $0 |
| 2019 | $9,623 | $544,754 | $411,947 | $132,807 |
| 2018 | $8,977 | $508,681 | $0 | $0 |
| 2017 | $8,716 | $488,401 | $0 | $0 |
| 2016 | $3,294 | $221,891 | $0 | $0 |
| 2015 | $3,357 | $220,349 | $0 | $0 |
| 2014 | $3,341 | $218,600 | $0 | $0 |
Source: Public Records
Map
Nearby Homes
- 11185 5th St E
- 11305 5th St E
- 11325 5th St E
- 11340 5th St E
- 11320 6th St E
- 11100 5th St E
- 11105 5th St E
- 11145 4th St E
- 11050 5th St E
- 11425 5th St E
- 11405 6th St E
- 605 115th Ave
- 635 115th Ave
- 510 115th Ave
- 11055 6th St E
- 600 115th Ave
- 11460 7th St E
- 11365 7th St E
- 11045 3rd St E Unit 6
- 11465 7th St E
Your Personal Tour Guide
Ask me questions while you tour the home.