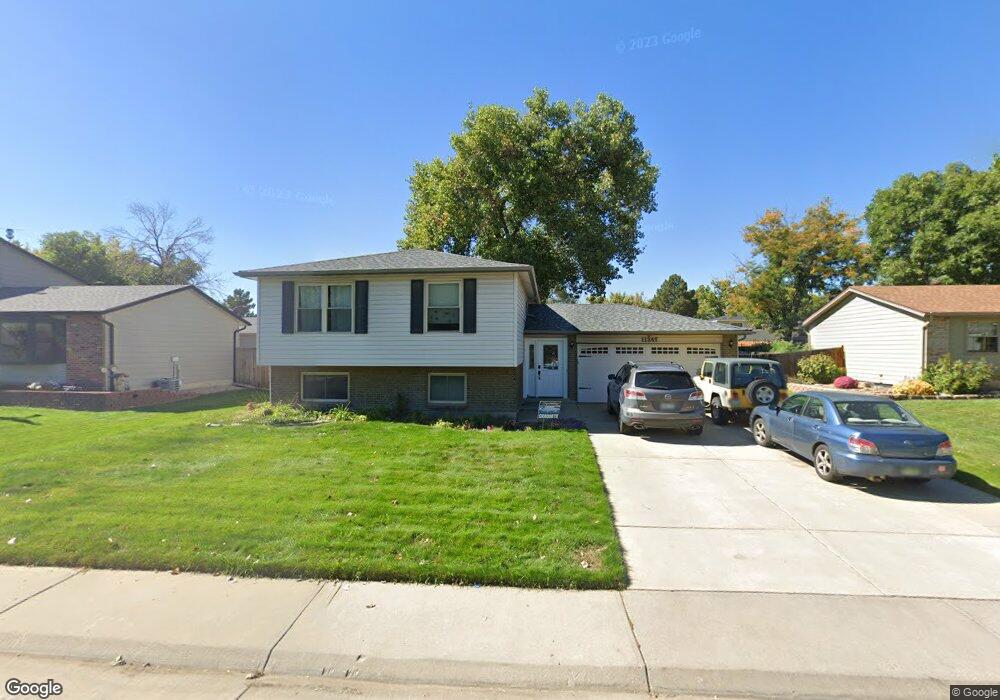
11247 Clermont Way Thornton, CO 80233
Woodglen NeighborhoodEstimated Value: $469,205 - $564,000
4
Beds
2
Baths
1,800
Sq Ft
$286/Sq Ft
Est. Value
About This Home
This home is located at 11247 Clermont Way, Thornton, CO 80233 and is currently estimated at $514,301, approximately $285 per square foot. 11247 Clermont Way is a home located in Adams County with nearby schools including Cherry Drive Elementary School, Shadow Ridge Middle School, and Mountain Range High School.
Ownership History
Date
Name
Owned For
Owner Type
Purchase Details
Closed on
Mar 23, 2012
Sold by
The Buy Out Company Llp
Bought by
Plummer Ian M
Current Estimated Value
Home Financials for this Owner
Home Financials are based on the most recent Mortgage that was taken out on this home.
Original Mortgage
$131,000
Outstanding Balance
$90,159
Interest Rate
3.91%
Mortgage Type
New Conventional
Estimated Equity
$424,142
Purchase Details
Closed on
Dec 9, 2011
Sold by
Lenhart Carolyn L
Bought by
The Buy Out Company Lllp
Purchase Details
Closed on
Jul 18, 2008
Sold by
Lenhart Carolyn L
Bought by
Seefeldt James L
Purchase Details
Closed on
May 4, 1993
Create a Home Valuation Report for This Property
The Home Valuation Report is an in-depth analysis detailing your home's value as well as a comparison with similar homes in the area
Home Values in the Area
Average Home Value in this Area
Purchase History
| Date | Buyer | Sale Price | Title Company |
|---|---|---|---|
| Plummer Ian M | $164,000 | Land Title Guarantee Company | |
| The Buy Out Company Lllp | -- | None Available | |
| Seefeldt James L | -- | None Available | |
| -- | $94,900 | -- |
Source: Public Records
Mortgage History
| Date | Status | Borrower | Loan Amount |
|---|---|---|---|
| Open | Plummer Ian M | $131,000 |
Source: Public Records
Tax History Compared to Growth
Tax History
| Year | Tax Paid | Tax Assessment Tax Assessment Total Assessment is a certain percentage of the fair market value that is determined by local assessors to be the total taxable value of land and additions on the property. | Land | Improvement |
|---|---|---|---|---|
| 2024 | $2,879 | $27,440 | $6,130 | $21,310 |
| 2023 | $2,849 | $31,530 | $6,090 | $25,440 |
| 2022 | $2,714 | $23,850 | $6,190 | $17,660 |
| 2021 | $2,714 | $23,850 | $6,190 | $17,660 |
| 2020 | $2,481 | $22,240 | $6,360 | $15,880 |
| 2019 | $2,486 | $22,240 | $6,360 | $15,880 |
| 2018 | $2,153 | $18,710 | $6,120 | $12,590 |
| 2017 | $1,958 | $18,710 | $6,120 | $12,590 |
| 2016 | $1,610 | $14,980 | $3,340 | $11,640 |
| 2015 | $1,608 | $14,980 | $3,340 | $11,640 |
| 2014 | $1,424 | $12,900 | $2,710 | $10,190 |
Source: Public Records
Map
Nearby Homes
- 4520 E 112th Place
- 4911 E 112th Place
- 11135 Clermont Dr
- 4346 E 113th Place
- 5055 E 112th Ct
- 5056 E 112th Ct
- 4807 E 110th Place
- 11068 Eudora Cir
- 11062 Fairfax Cir
- 11343 Grape Cir
- 10895 Fairfax Way
- 11279 Holly St
- 11293 Holly St
- 10985 Glencoe Place
- 10979 Grange Creek Dr
- 4355 E 118th Ave
- 11546 Monroe Way
- 5452 E 108th Place
- 11354 Jersey St
- 11841 Elm Dr
- 11257 Clermont Way
- 11237 Clermont Way
- 11250 Clermont Ct
- 11240 Clermont Ct
- 11267 Clermont Way
- 11260 Clermont Ct
- 11242 Clermont Way
- 11252 Clermont Way
- 11230 Clermont Ct
- 11262 Clermont Way
- 11270 Clermont Ct
- 11277 Clermont Way
- 4711 E 112th Place
- 11272 Clermont Way
- 11241 Dexter Cir
- 11261 Dexter Cir
- 4680 E 112th Place
- 4700 E 112th Place
- 11280 Clermont Ct
- 11287 Clermont Way