1125 4th St N Fargo, ND 58102
Horace Mann NeighborhoodEstimated Value: $194,000 - $273,000
--
Bed
--
Bath
1,416
Sq Ft
$160/Sq Ft
Est. Value
About This Home
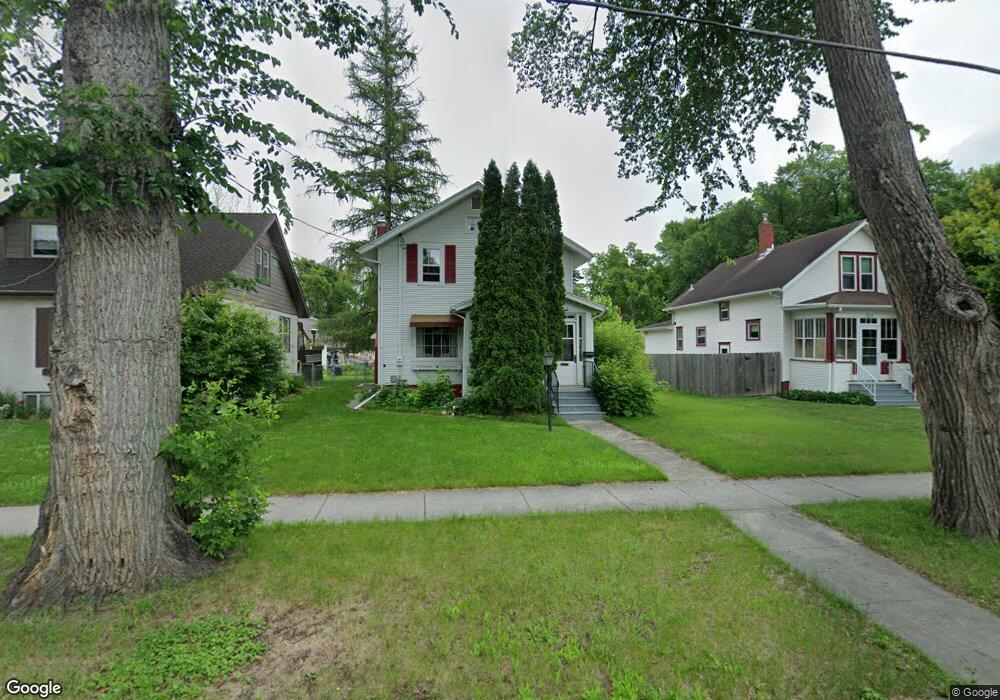
This home is located at 1125 4th St N, Fargo, ND 58102 and is currently estimated at $226,141, approximately $159 per square foot. 1125 4th St N is a home located in Cass County with nearby schools including Horace Mann Roosevelt Elementary School, Ben Franklin Middle School, and North High School.
Ownership History
Date
Name
Owned For
Owner Type
Purchase Details
Closed on
Sep 17, 2025
Sold by
Labounty Stuart Joseph
Bought by
Labounty Amy Elin
Current Estimated Value
Purchase Details
Closed on
Feb 26, 2014
Sold by
John D And Cydney J Runsvold Family Lp
Bought by
Labounty Stuart and Labounty Amy
Purchase Details
Closed on
Mar 21, 2007
Sold by
Runsvold John D and Runsvold Cydney J
Bought by
John D And Cydney J Runsvold Family Lp
Purchase Details
Closed on
Jul 14, 2006
Sold by
John D Cydney J Runsvold Family Lp
Bought by
Runsvold John D and Runsvold Cydney J
Create a Home Valuation Report for This Property
The Home Valuation Report is an in-depth analysis detailing your home's value as well as a comparison with similar homes in the area
Home Values in the Area
Average Home Value in this Area
Purchase History
| Date | Buyer | Sale Price | Title Company |
|---|---|---|---|
| Labounty Amy Elin | -- | None Listed On Document | |
| Labounty Stuart | $97,000 | 2 Title Co | |
| John D And Cydney J Runsvold Family Lp | -- | -- | |
| Runsvold John D | -- | -- |
Source: Public Records
Tax History Compared to Growth
Tax History
| Year | Tax Paid | Tax Assessment Tax Assessment Total Assessment is a certain percentage of the fair market value that is determined by local assessors to be the total taxable value of land and additions on the property. | Land | Improvement |
|---|---|---|---|---|
| 2024 | $2,007 | $111,550 | $19,200 | $92,350 |
| 2023 | $2,185 | $98,700 | $19,200 | $79,500 |
| 2022 | $4,390 | $88,900 | $19,200 | $69,700 |
| 2021 | $4,155 | $80,800 | $19,200 | $61,600 |
| 2020 | $3,087 | $73,450 | $19,200 | $54,250 |
| 2019 | $3,114 | $73,450 | $11,400 | $62,050 |
| 2018 | $3,736 | $97,450 | $11,400 | $86,050 |
| 2017 | $3,613 | $92,800 | $11,400 | $81,400 |
| 2016 | $3,479 | $90,100 | $11,400 | $78,700 |
| 2015 | $2,428 | $68,750 | $7,800 | $60,950 |
| 2014 | $1,644 | $62,500 | $7,800 | $54,700 |
| 2013 | $1,599 | $60,700 | $7,800 | $52,900 |
Source: Public Records
Map
Nearby Homes