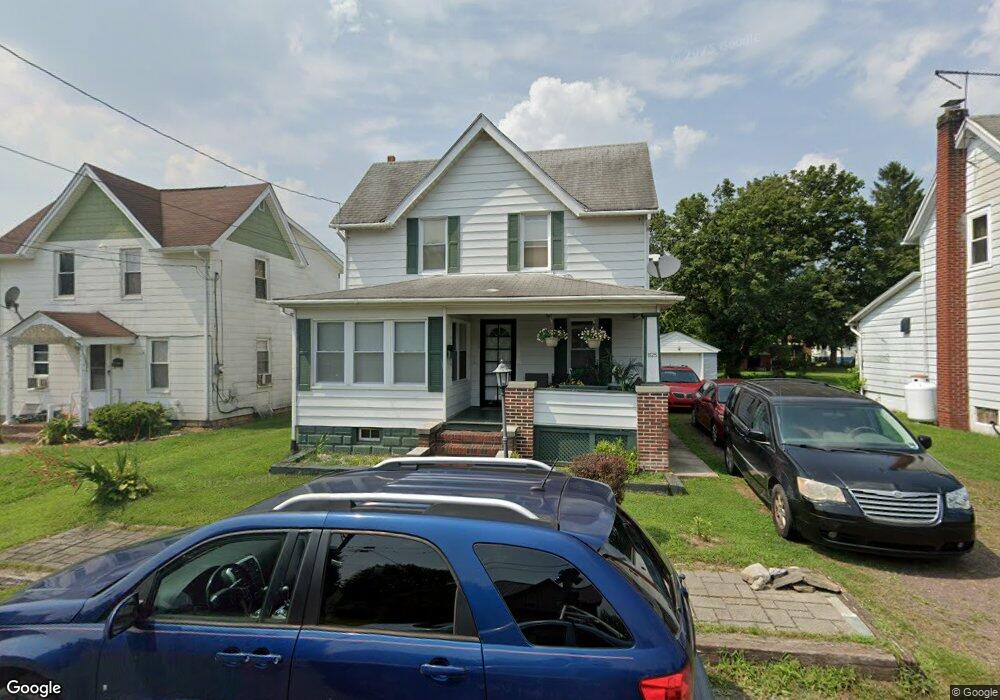
1125 7th Ave Berwick, PA 18603
Estimated Value: $173,000 - $220,000
Studio
--
Bath
1,672
Sq Ft
$117/Sq Ft
Est. Value
About This Home
This home is located at 1125 7th Ave, Berwick, PA 18603 and is currently estimated at $196,165, approximately $117 per square foot. 1125 7th Ave is a home located in Columbia County with nearby schools including Berwick Area High School, Holy Family Consolidated School, and New Story School.
Ownership History
Date
Name
Owned For
Owner Type
Purchase Details
Closed on
Aug 14, 2015
Sold by
Gerhard Catherine A
Bought by
Thelemaque Miche and Thelemaque Jean Marie
Current Estimated Value
Home Financials for this Owner
Home Financials are based on the most recent Mortgage that was taken out on this home.
Original Mortgage
$96,911
Outstanding Balance
$77,089
Interest Rate
4.37%
Mortgage Type
FHA
Estimated Equity
$119,076
Purchase Details
Closed on
Mar 2, 2015
Sold by
U S Bank National Association
Bought by
Gerhard Catherine A
Purchase Details
Closed on
Feb 22, 2007
Sold by
Wallick Frank C and Mardon Lynn E
Bought by
Breisch Jeffery E and Breisch Amy M
Home Financials for this Owner
Home Financials are based on the most recent Mortgage that was taken out on this home.
Original Mortgage
$88,673
Interest Rate
6.4%
Mortgage Type
VA
Create a Home Valuation Report for This Property
The Home Valuation Report is an in-depth analysis detailing your home's value as well as a comparison with similar homes in the area
Home Values in the Area
Average Home Value in this Area
Purchase History
| Date | Buyer | Sale Price | Title Company |
|---|---|---|---|
| Thelemaque Miche | $98,700 | None Available | |
| Gerhard Catherine A | $31,500 | None Available | |
| Breisch Jeffery E | $86,900 | None Available |
Source: Public Records
Mortgage History
| Date | Status | Borrower | Loan Amount |
|---|---|---|---|
| Open | Thelemaque Miche | $96,911 | |
| Previous Owner | Breisch Jeffery E | $88,673 |
Source: Public Records
Tax History
| Year | Tax Paid | Tax Assessment Tax Assessment Total Assessment is a certain percentage of the fair market value that is determined by local assessors to be the total taxable value of land and additions on the property. | Land | Improvement |
|---|---|---|---|---|
| 2025 | $1,628 | $21,271 | $0 | $0 |
| 2024 | $1,596 | $21,271 | $2,016 | $19,255 |
| 2023 | $1,469 | $21,271 | $2,016 | $19,255 |
| 2022 | $1,411 | $21,271 | $2,016 | $19,255 |
| 2021 | $1,373 | $21,271 | $2,016 | $19,255 |
| 2020 | $1,336 | $21,271 | $2,016 | $19,255 |
| 2019 | $1,331 | $21,271 | $2,016 | $19,255 |
| 2018 | $1,332 | $21,271 | $2,016 | $19,255 |
| 2017 | $1,337 | $21,271 | $2,016 | $19,255 |
| 2016 | -- | $21,271 | $2,016 | $19,255 |
| 2015 | -- | $21,271 | $2,016 | $19,255 |
| 2014 | -- | $19,301 | $2,000 | $17,301 |
Source: Public Records
Map
Nearby Homes
- 1149 6th Ave
- 1411 N Warren St
- 1200 5th Ave
- 1129 Freas Ave
- 825 N Mercer St
- LOT #13 3rd Ave
- 721 Lasalle St
- 1185 Ferris Ave
- 1500 2nd Ave
- 1201 N Market St
- 405 N Mercer St
- 1224 Orange St
- 1609,1611 Orange St
- 911 N Mulberry St
- 1830 Chestnut St
- 305 Summerhill Ave
- 239 E 15th St
- 1333 7th Ave
- 108 110 Blair St
- 334 Washington St
Your Personal Tour Guide
Ask me questions while you tour the home.