Estimated Value: $59,203 - $70,000
2
Beds
1
Bath
982
Sq Ft
$67/Sq Ft
Est. Value
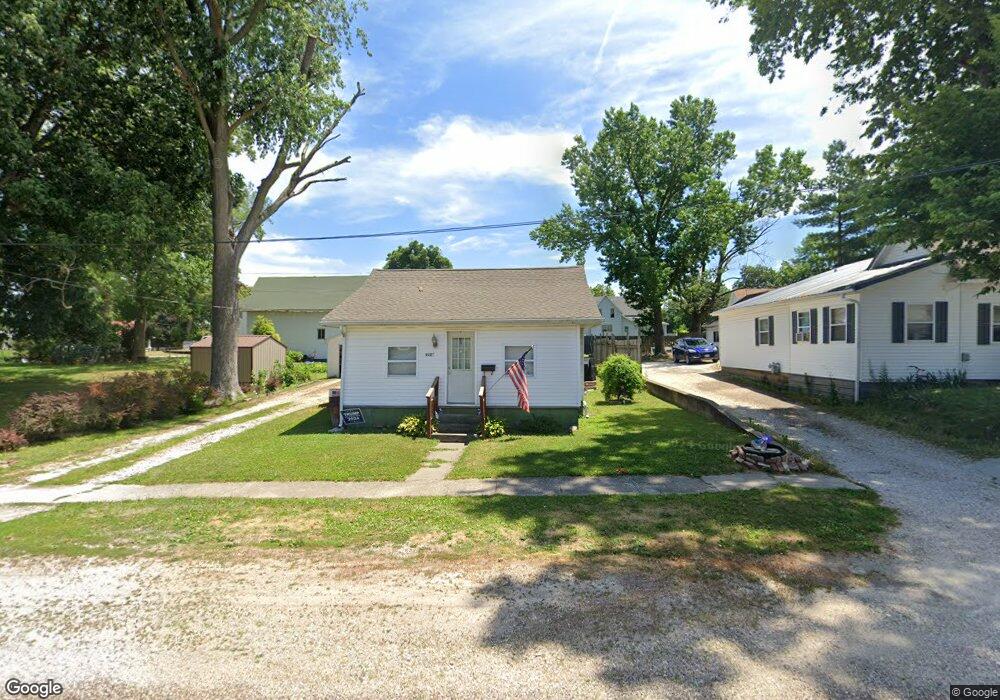
About This Home
This home is located at 1125 Bainbridge St, Barry, IL 62312 and is currently estimated at $65,801, approximately $67 per square foot. 1125 Bainbridge St is a home located in Pike County with nearby schools including Western Junior High School, Western Barry Elementary School, and Western High School.
Ownership History
Date
Name
Owned For
Owner Type
Purchase Details
Closed on
Aug 29, 2019
Sold by
Hathaway Sherri
Bought by
Davis Rebecca L
Current Estimated Value
Home Financials for this Owner
Home Financials are based on the most recent Mortgage that was taken out on this home.
Original Mortgage
$34,000
Outstanding Balance
$22,663
Interest Rate
3.8%
Mortgage Type
New Conventional
Estimated Equity
$43,138
Purchase Details
Closed on
Jul 29, 2019
Sold by
Housmann Harrison Lee and Hathaway Michele
Bought by
Hathaway Sherri
Home Financials for this Owner
Home Financials are based on the most recent Mortgage that was taken out on this home.
Original Mortgage
$34,000
Outstanding Balance
$22,663
Interest Rate
3.8%
Mortgage Type
New Conventional
Estimated Equity
$43,138
Purchase Details
Closed on
Nov 24, 2015
Sold by
Kenning Brian
Bought by
Housemann Harrison Lee and Hathaway Michele
Purchase Details
Closed on
Apr 10, 2013
Sold by
Jpmorgan Chase Bank Na
Bought by
Kenning Brian
Create a Home Valuation Report for This Property
The Home Valuation Report is an in-depth analysis detailing your home's value as well as a comparison with similar homes in the area
Home Values in the Area
Average Home Value in this Area
Purchase History
| Date | Buyer | Sale Price | Title Company |
|---|---|---|---|
| Davis Rebecca L | $42,600 | Attorney | |
| Hathaway Sherri | -- | Attorney | |
| Housemann Harrison Lee | $24,750 | Attorney | |
| Kenning Brian | -- | -- |
Source: Public Records
Mortgage History
| Date | Status | Borrower | Loan Amount |
|---|---|---|---|
| Open | Davis Rebecca L | $34,000 |
Source: Public Records
Tax History Compared to Growth
Tax History
| Year | Tax Paid | Tax Assessment Tax Assessment Total Assessment is a certain percentage of the fair market value that is determined by local assessors to be the total taxable value of land and additions on the property. | Land | Improvement |
|---|---|---|---|---|
| 2024 | -- | $18,940 | $2,640 | $16,300 |
| 2023 | -- | $17,230 | $2,400 | $14,830 |
| 2022 | $0 | $15,740 | $2,190 | $13,550 |
| 2021 | $544 | $15,000 | $2,090 | $12,910 |
| 2020 | $770 | $15,000 | $2,090 | $12,910 |
| 2019 | $762 | $14,690 | $2,037 | $12,653 |
| 2018 | $764 | $14,690 | $2,037 | $12,653 |
| 2015 | $598 | $14,000 | $1,940 | $12,060 |
| 2013 | $598 | $14,080 | $1,950 | $12,130 |
| 2010 | $598 | $13,270 | $1,840 | $11,430 |
Source: Public Records
Map
Nearby Homes
- 400 Mortimer St
- 390 Mortimer St
- 2 Plaza
- 24080 287th Ave
- 28383 290th St
- 160 S Church St
- 245 E Mississippi St
- 31242-31298 260th St
- 395 Van Buren St
- 000 205th St
- Co Hwy 10
- 0 N 250th Ave Unit Lot WP001 22517988
- 2629 N 300th Place
- 87.12 acres Sec 17 3s 5w
- 110 S East St
- 000 E 2975th St
- .031 ac m/l Angle St
- 0.31 ac m/l Angle St
- 32440 Jim Town Hollow Rd
- 79 State Hwy
- 1135 Bainbridge St
- 1126 Bainbridge St
- 1145 Bainbridge St
- 1114 Bainbridge St
- 1105 Bainbridge St
- 1132 Bainbridge St
- 1144 Bainbridge St
- 1104 Bainbridge St
- 1155 Bainbridge St
- 1156 Bainbridge St
- 870 Pratt St
- 1165 Bainbridge St
- 1146 Rodgers St
- 1164 Bainbridge St
- 1133 Decatur St
- 1085 Bainbridge St
- 1084 Bainbridge St
- 1125 Decatur St
- 1162 Rodgers St
- 1115 Decatur St