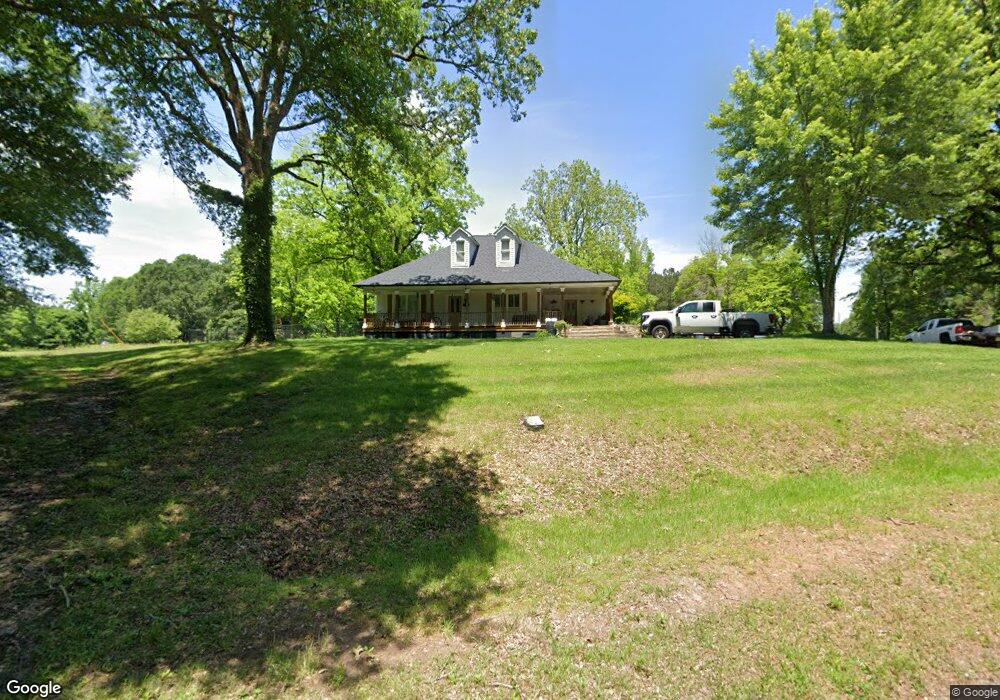
1125 Beulah Church Rd Carrollton, GA 30117
Estimated Value: $368,146 - $457,000
4
Beds
3
Baths
2,235
Sq Ft
$183/Sq Ft
Est. Value
About This Home
This home is located at 1125 Beulah Church Rd, Carrollton, GA 30117 and is currently estimated at $409,537, approximately $183 per square foot. 1125 Beulah Church Rd is a home located in Carroll County with nearby schools including Mt. Zion Elementary School, Mt. Zion Middle School, and Mt. Zion High School.
Ownership History
Date
Name
Owned For
Owner Type
Purchase Details
Closed on
Dec 7, 2017
Sold by
Flanagan Wendy
Bought by
Sapp Casey Dylan and Sapp Selina Nicole
Current Estimated Value
Home Financials for this Owner
Home Financials are based on the most recent Mortgage that was taken out on this home.
Original Mortgage
$205,106
Outstanding Balance
$171,688
Interest Rate
3.9%
Mortgage Type
New Conventional
Estimated Equity
$237,849
Purchase Details
Closed on
Jan 11, 2008
Sold by
Prudential Relocation Inc
Bought by
Flanagan Wendy and Flanagan Stacey
Home Financials for this Owner
Home Financials are based on the most recent Mortgage that was taken out on this home.
Original Mortgage
$210,000
Interest Rate
6.06%
Mortgage Type
New Conventional
Purchase Details
Closed on
Apr 24, 1999
Sold by
Starks Lloyd L
Bought by
Starks Lloyd L
Purchase Details
Closed on
Oct 14, 1998
Sold by
Chandler Talmadge S
Bought by
Starks Lloyd L
Purchase Details
Closed on
Nov 24, 1997
Sold by
Brock Monica A
Bought by
Chandler Talmadge S
Purchase Details
Closed on
Mar 24, 1995
Bought by
Brock Monica A
Create a Home Valuation Report for This Property
The Home Valuation Report is an in-depth analysis detailing your home's value as well as a comparison with similar homes in the area
Home Values in the Area
Average Home Value in this Area
Purchase History
| Date | Buyer | Sale Price | Title Company |
|---|---|---|---|
| Sapp Casey Dylan | $211,450 | -- | |
| Flanagan Wendy | $210,000 | -- | |
| Prudential Relocation Inc | $210,000 | -- | |
| Starks Lloyd L | -- | -- | |
| Starks Lloyd L | $50,000 | -- | |
| Chandler Talmadge S | $52,000 | -- | |
| Brock Monica A | $25,000 | -- |
Source: Public Records
Mortgage History
| Date | Status | Borrower | Loan Amount |
|---|---|---|---|
| Open | Sapp Casey Dylan | $205,106 | |
| Previous Owner | Prudential Relocation Inc | $210,000 |
Source: Public Records
Tax History Compared to Growth
Tax History
| Year | Tax Paid | Tax Assessment Tax Assessment Total Assessment is a certain percentage of the fair market value that is determined by local assessors to be the total taxable value of land and additions on the property. | Land | Improvement |
|---|---|---|---|---|
| 2025 | $3,189 | $142,551 | $30,042 | $112,509 |
| 2024 | $3,225 | $142,551 | $30,042 | $112,509 |
| 2023 | $3,225 | $126,216 | $24,034 | $102,182 |
| 2022 | $2,456 | $97,930 | $16,022 | $81,908 |
| 2021 | $2,125 | $82,902 | $12,818 | $70,084 |
| 2020 | $1,892 | $73,721 | $11,653 | $62,068 |
| 2019 | $1,751 | $67,675 | $11,653 | $56,022 |
| 2018 | $1,074 | $40,901 | $5,019 | $35,882 |
| 2017 | $972 | $40,913 | $5,031 | $35,882 |
| 2016 | $973 | $40,913 | $5,031 | $35,882 |
| 2015 | $1,219 | $47,590 | $9,534 | $38,057 |
| 2014 | $1,224 | $47,591 | $9,534 | $38,057 |
Source: Public Records
Map
Nearby Homes
- 132 Pinnacle Way
- 1423 Beulah Church Rd
- 442 Plowshare Rd
- 2080 Mount Zion Rd
- 0 Skinner Rd
- 000 Beulah Church Rd
- 105 Winston Way
- 113 Richmond Dr
- 0 Beulah Church Rd Unit 10366052
- 190 Marvin Gray Rd
- 1915 Whooping Creek Church Road - Tract #1
- 1915 Whooping Creek Church Road - Tract #2
- 101 Bonnie Lynn Ln
- 223 Riversong Rd Unit 55
- 223 Riversong Rd
- 106 Summerfield Place Dr
- 2070 Lovvorn Rd
- 113 Natures Pointe Trail
- 142 Riversong Rd Unit 56
- 104 Summerfield Place Dr
- 0 Virgil Ln Unit 23596660
- 0 Virgil Ln Unit 8314199
- 1087 Beulah Church Rd
- 41 Virgil Ln
- 1084 Beulah Church Rd
- Virgil Virgil Ln
- 1146 Beulah Church Rd
- 1173 Beulah Church Rd
- 51 Virgil Ln
- 000 Virgil Ln
- 38 Virgil Ln
- 1065 Beulah Church Rd
- 61 Virgil Ln
- 1056 Beulah Church Rd
- 56 Virgil Ln
- 1026 Beulah Church Rd
- 1015 Beulah Church Rd
- 1249 Beulah Church Rd
- 1012 Beulah Church Rd
- 998 Beulah Church Rd