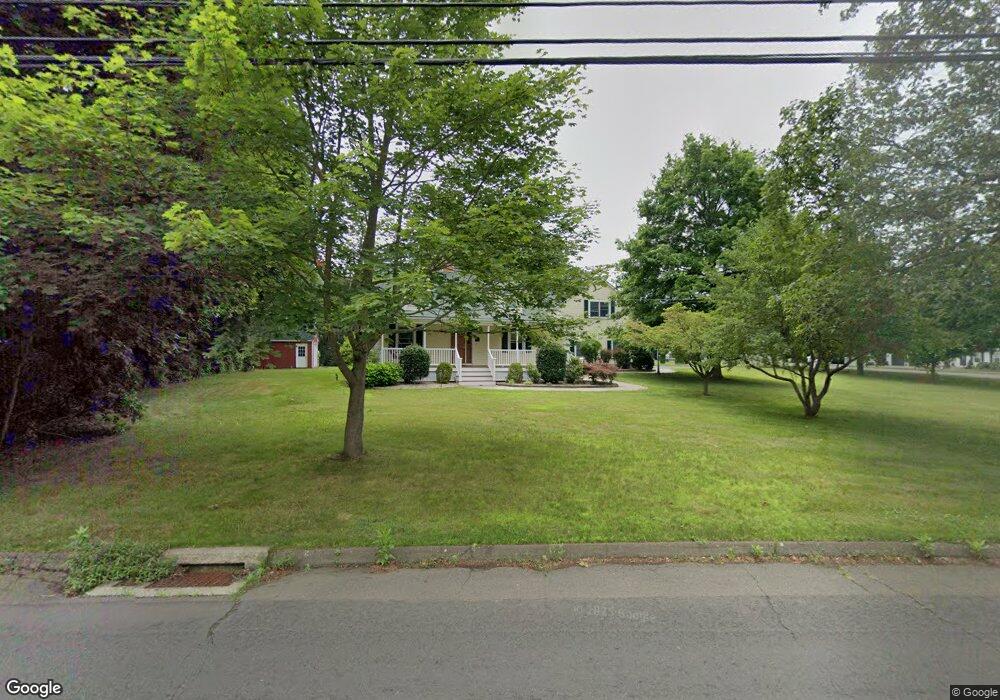
1125 Durham Rd Wallingford, CT 06492
Estimated Value: $451,000 - $686,000
About This Home
This home is located at 1125 Durham Rd, Wallingford, CT 06492 and is currently estimated at $603,614, approximately $207 per square foot. 1125 Durham Rd is a home located in New Haven County with nearby schools including Moses Y Beach Elementary School, Rock Hill Elementary School, and Dag Hammarskjold Middle School.
Ownership History
We collect this data history from publicly available records. To have your information removed, we recommend requesting removal directly through your county’s website.
Purchase Details
Purchase Details
Home Values in the Area
Average Home Value in this Area
Purchase History
We collect this data history from publicly available records. To have your information removed, we recommend requesting removal directly through your county’s website.
| Date | Buyer | Sale Price | Title Company |
|---|---|---|---|
| $125,000 | -- | ||
| $125,000 | -- | ||
| $65,000 | -- | ||
| $65,000 | -- |
Mortgage History
We collect this data history from publicly available records. To have your information removed, we recommend requesting removal directly through your county’s website.
| Date | Status | Borrower | Loan Amount |
|---|---|---|---|
| Open | $140,000 | ||
| Closed | $215,000 |
Tax History
We collect this data history from publicly available records. To have your information removed, we recommend requesting removal directly through your county’s website.
| Year | Tax Paid | Tax Assessment Tax Assessment Total Assessment is a certain percentage of the fair market value that is determined by local assessors to be the total taxable value of land and additions on the property. | Land | Improvement |
|---|---|---|---|---|
| 2025 | $10,791 | $447,400 | $113,100 | $334,300 |
| 2024 | $9,327 | $304,200 | $96,400 | $207,800 |
| 2023 | $8,925 | $304,200 | $96,400 | $207,800 |
| 2022 | $7,983 | $274,900 | $96,400 | $178,500 |
| 2021 | $6,327 | $274,900 | $96,400 | $178,500 |
| 2020 | $7,636 | $261,600 | $92,300 | $169,300 |
| 2019 | $7,636 | $261,600 | $92,300 | $169,300 |
| 2018 | $7,492 | $261,600 | $92,300 | $169,300 |
| 2017 | $5,768 | $261,600 | $92,300 | $169,300 |
| 2016 | $7,296 | $261,600 | $92,300 | $169,300 |
| 2015 | $7,376 | $268,500 | $92,300 | $176,200 |
| 2014 | $7,220 | $268,500 | $92,300 | $176,200 |
Map
- 1095 Durham Rd
- 326 Grieb Rd
- 12 Grieb Trail
- 52 Grieb Trail
- 350 Williams Rd
- 940 Durham Rd
- 349 E Main St
- 58 Grieb Rd
- 976 Old Rock Hill Rd
- 4 Poppy Ln
- 132 N Airline Rd
- 12 Briarwood Ln
- 63 High Hill Rd
- 44 Farm Hill Rd
- 18 Grantham Rd
- 26 Beechwood Dr
- 50 Carr St
- 13 Walnut Ln
- 1015 Northrop Rd
- 6 Sterling Village Unit 6
Ask me questions while you tour the home.