1125 E 8th St Berwick, PA 18603
Estimated Value: $177,422 - $223,000
Studio
--
Bath
1,113
Sq Ft
$182/Sq Ft
Est. Value
About This Home
This home is located at 1125 E 8th St, Berwick, PA 18603 and is currently estimated at $202,856, approximately $182 per square foot. 1125 E 8th St is a home located in Luzerne County with nearby schools including Berwick Area High School, Holy Family Consolidated School, and New Story School.
Ownership History
Date
Name
Owned For
Owner Type
Purchase Details
Closed on
Apr 30, 2020
Sold by
Mccabe Angela S
Bought by
Antolik Andrew David
Current Estimated Value
Home Financials for this Owner
Home Financials are based on the most recent Mortgage that was taken out on this home.
Original Mortgage
$106,850
Outstanding Balance
$71,429
Interest Rate
3.3%
Mortgage Type
New Conventional
Estimated Equity
$131,427
Purchase Details
Closed on
Jun 12, 2014
Sold by
Baucher Margaret A
Bought by
Mccabe Angela S
Purchase Details
Closed on
Jan 19, 2006
Sold by
Plymouth Diversified Services Inc
Bought by
Baucher Karl E and Baucher Margaret A
Home Financials for this Owner
Home Financials are based on the most recent Mortgage that was taken out on this home.
Original Mortgage
$97,000
Interest Rate
6.16%
Mortgage Type
Purchase Money Mortgage
Create a Home Valuation Report for This Property
The Home Valuation Report is an in-depth analysis detailing your home's value as well as a comparison with similar homes in the area
Home Values in the Area
Average Home Value in this Area
Purchase History
| Date | Buyer | Sale Price | Title Company |
|---|---|---|---|
| Antolik Andrew David | $112,500 | None Available | |
| Mccabe Angela S | -- | None Available | |
| Baucher Karl E | $97,000 | None Available |
Source: Public Records
Mortgage History
| Date | Status | Borrower | Loan Amount |
|---|---|---|---|
| Open | Antolik Andrew David | $106,850 | |
| Previous Owner | Baucher Karl E | $97,000 |
Source: Public Records
Tax History
| Year | Tax Paid | Tax Assessment Tax Assessment Total Assessment is a certain percentage of the fair market value that is determined by local assessors to be the total taxable value of land and additions on the property. | Land | Improvement |
|---|---|---|---|---|
| 2026 | $2,196 | $96,200 | $47,100 | $49,100 |
| 2025 | $2,166 | $96,200 | $47,100 | $49,100 |
| 2024 | $2,101 | $96,200 | $47,100 | $49,100 |
| 2023 | $2,018 | $96,200 | $47,100 | $49,100 |
| 2022 | $2,000 | $96,200 | $47,100 | $49,100 |
| 2021 | $2,000 | $96,200 | $47,100 | $49,100 |
| 2020 | $1,728 | $96,200 | $47,100 | $49,100 |
| 2019 | $1,715 | $96,200 | $47,100 | $49,100 |
| 2018 | $1,702 | $96,200 | $47,100 | $49,100 |
| 2017 | $1,780 | $96,200 | $47,100 | $49,100 |
| 2016 | -- | $96,200 | $47,100 | $49,100 |
| 2015 | -- | $96,200 | $47,100 | $49,100 |
| 2014 | -- | $96,200 | $47,100 | $49,100 |
Source: Public Records
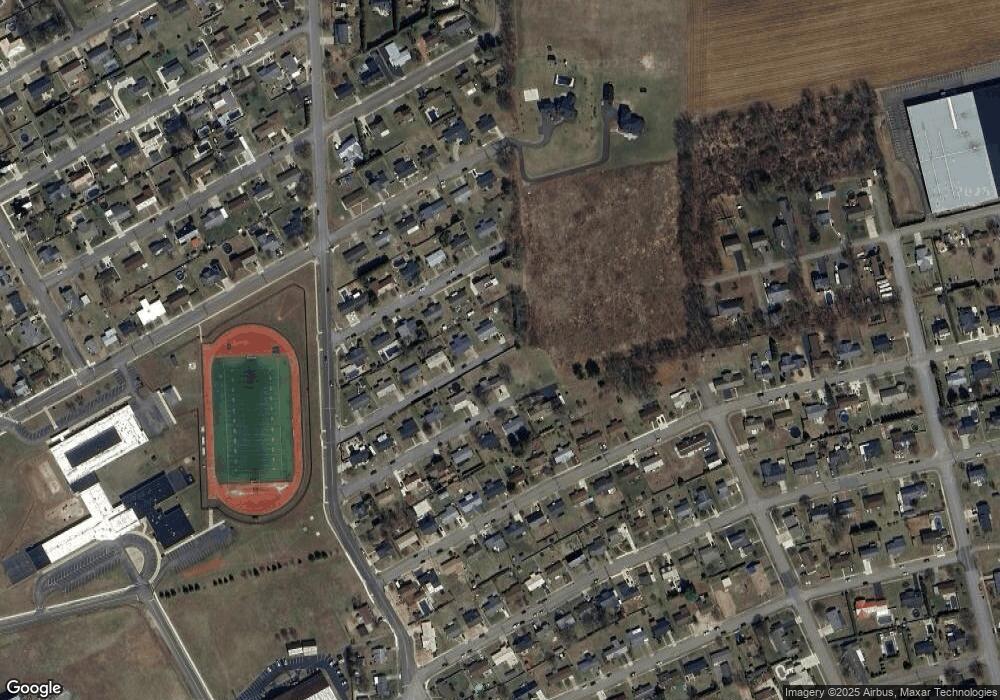
Map
Nearby Homes
Your Personal Tour Guide
Ask me questions while you tour the home.