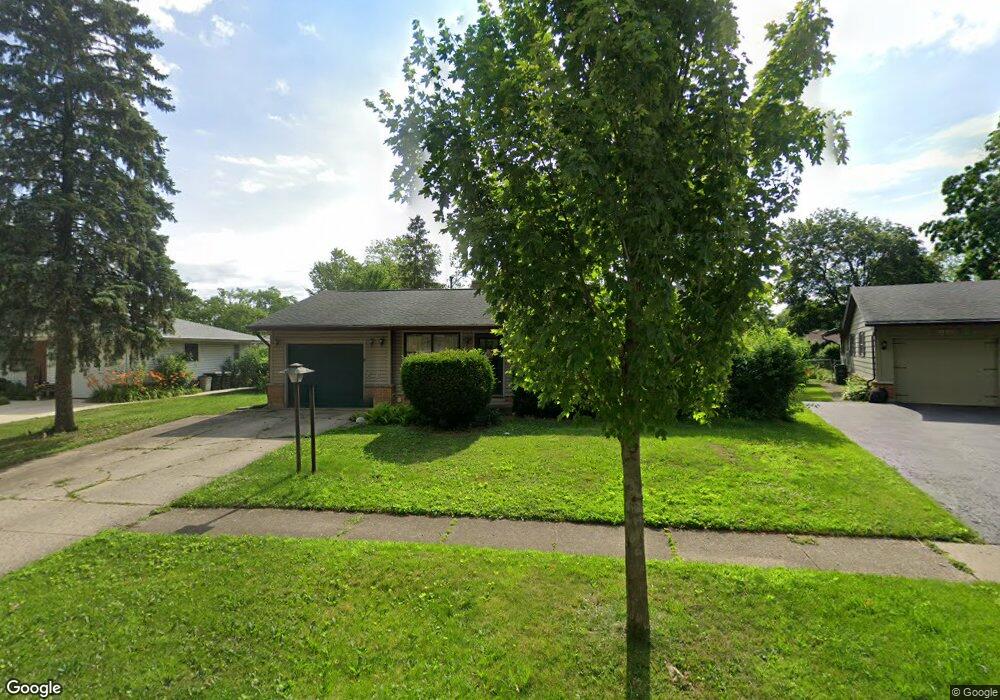
1125 Elmwood Ln Elk Grove Village, IL 60007
Elk Grove Village East NeighborhoodEstimated Value: $276,000 - $375,000
2
Beds
1
Bath
1,022
Sq Ft
$318/Sq Ft
Est. Value
About This Home
This home is located at 1125 Elmwood Ln, Elk Grove Village, IL 60007 and is currently estimated at $324,696, approximately $317 per square foot. 1125 Elmwood Ln is a home located in Cook County with nearby schools including Clearmont Elementary School, Grove Jr High School, and Elk Grove High School.
Ownership History
Date
Name
Owned For
Owner Type
Purchase Details
Closed on
Jul 8, 2002
Sold by
Witon Brian S and Witon Rhonda S
Bought by
Forman Morris F and Egan Roxanne R
Current Estimated Value
Home Financials for this Owner
Home Financials are based on the most recent Mortgage that was taken out on this home.
Original Mortgage
$120,000
Outstanding Balance
$51,195
Interest Rate
6.8%
Estimated Equity
$273,501
Purchase Details
Closed on
Jan 16, 2001
Sold by
Doyle Patrick and Doyle Barbara
Bought by
Witon Brian S and Witon Rhonda S
Home Financials for this Owner
Home Financials are based on the most recent Mortgage that was taken out on this home.
Original Mortgage
$154,800
Interest Rate
7.22%
Purchase Details
Closed on
Sep 14, 1999
Sold by
Wolak Kevin J and Wolak Anna L
Bought by
Doyle Patrick and Doyle Barbara
Home Financials for this Owner
Home Financials are based on the most recent Mortgage that was taken out on this home.
Original Mortgage
$122,320
Interest Rate
7.87%
Mortgage Type
Balloon
Create a Home Valuation Report for This Property
The Home Valuation Report is an in-depth analysis detailing your home's value as well as a comparison with similar homes in the area
Home Values in the Area
Average Home Value in this Area
Purchase History
| Date | Buyer | Sale Price | Title Company |
|---|---|---|---|
| Forman Morris F | $195,000 | -- | |
| Witon Brian S | $172,000 | -- | |
| Doyle Patrick | $153,000 | Professional National Title |
Source: Public Records
Mortgage History
| Date | Status | Borrower | Loan Amount |
|---|---|---|---|
| Open | Forman Morris F | $120,000 | |
| Previous Owner | Witon Brian S | $154,800 | |
| Previous Owner | Doyle Patrick | $122,320 |
Source: Public Records
Tax History Compared to Growth
Tax History
| Year | Tax Paid | Tax Assessment Tax Assessment Total Assessment is a certain percentage of the fair market value that is determined by local assessors to be the total taxable value of land and additions on the property. | Land | Improvement |
|---|---|---|---|---|
| 2024 | $5,760 | $23,975 | $6,293 | $17,682 |
| 2023 | $5,517 | $26,000 | $6,293 | $19,707 |
| 2022 | $5,517 | $26,000 | $6,293 | $19,707 |
| 2021 | $4,044 | $17,899 | $3,933 | $13,966 |
| 2020 | $3,957 | $17,899 | $3,933 | $13,966 |
| 2019 | $4,007 | $19,888 | $3,933 | $15,955 |
| 2018 | $4,464 | $19,709 | $3,539 | $16,170 |
| 2017 | $4,449 | $19,709 | $3,539 | $16,170 |
| 2016 | $4,379 | $19,709 | $3,539 | $16,170 |
| 2015 | $3,987 | $17,512 | $2,949 | $14,563 |
| 2014 | $3,946 | $17,512 | $2,949 | $14,563 |
| 2013 | $3,841 | $17,512 | $2,949 | $14,563 |
Source: Public Records
Map
Nearby Homes
- 1043 Elmwood Ln
- 1060 Warwick Ln
- 1194 Cedar Ln
- 959 Ridge Ave
- 930 Wilshire Ave
- 248 Clearmont Dr
- 991 Cedar Ln
- 541 Sycamore Dr
- 260 Mulberry Ln
- 580 Walnut Ln
- 943 Maple Ln
- 685 Maple Ct
- 468 Birchwood Ave
- 370 E Elk Grove Blvd
- 110 Essex Rd
- 851 Crest Ave
- 836 Bonita Ave
- 908 Brantwood Ave
- 865 Love St
- 910 Lonsdale Rd
- 1113 Elmwood Ln
- 1137 Elmwood Ln
- 1146 Carswell Ave
- 1162 Carswell Ave
- 1130 Carswell Ave
- 1101 Elmwood Ln
- 1138 Elmwood Ln
- 1178 Carswell Ave
- 1149 Elmwood Ln
- 1112 Elmwood Ln
- 1158 Elmwood Ln
- 1093 Elmwood Ln
- 1198 Carswell Ave
- 1100 Elmwood Ln
- 1157 Elmwood Ln
- 1098 Carswell Ave
- 1198 Bosworth Ln
- 1092 Elmwood Ln
- 1179 Elmwood Ln
- 1087 Elmwood Ln