
Seller's Agent in 2021
Karen Richter
Re/Max Of Albany
(229) 854-3730
142 Total Sales

Estimated Value: $260,000 - $397,000
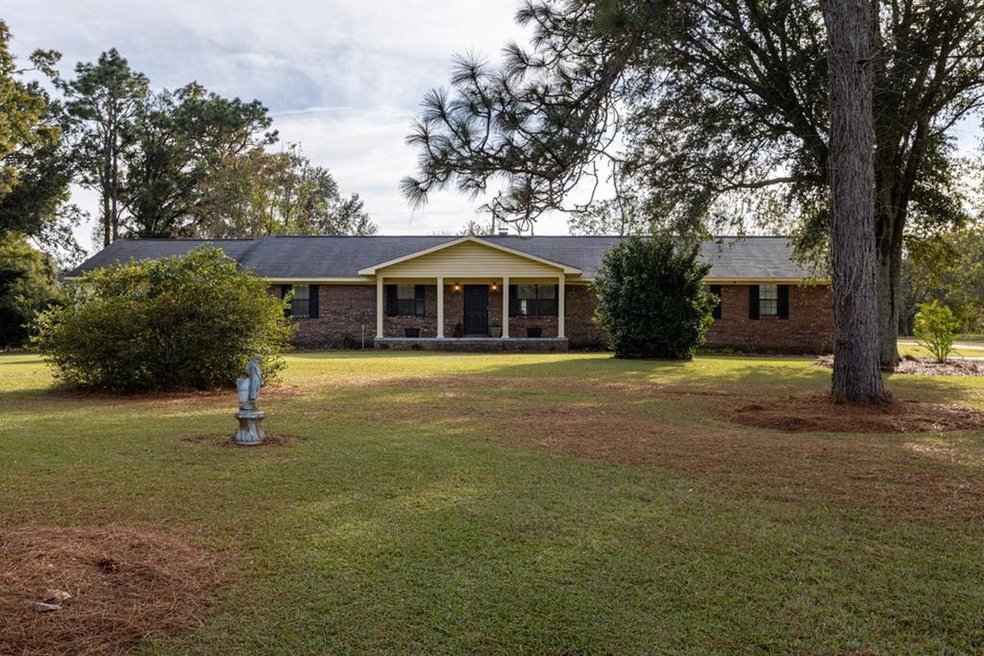
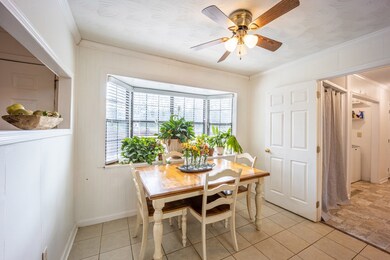
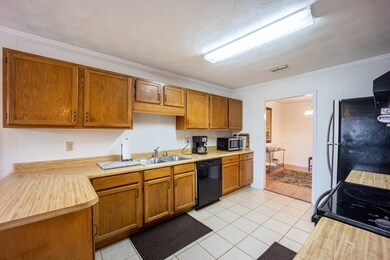
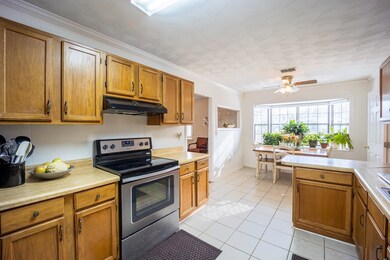
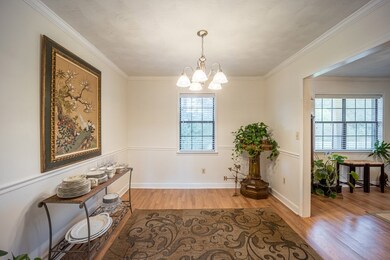
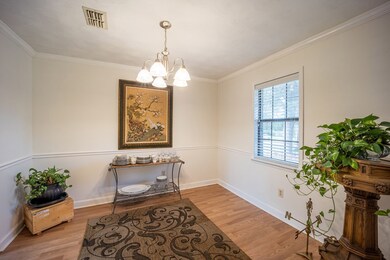
MINI-FARM on 20 acres. This 4 bedroom 3.5 bathroom brick home is almost 2800 sf. It features a large great room with a fireplace. The kitchen has plenty of cabinets, a breakfast area with a bay window, all appliances, and there also is a nice dining room. The area adjacent to the kitchen has a laundry closet, extra storage closets and a half bath. All the bedrooms are spacious. The master is approximately 400 square feet. Plenty of room for a sitting area and a desk for your home office. The walk-in closet is quite large and the master bathroom has a tiled shower and a nice vanity. There is room for an additional vanity as well. There is another large bedroom with a private bathroom. One bedroom could be an office or bonus room, and the 4th bedroom is spacious. There is a double carport, large patio with a brick fence and a nice covered front porch. The property is zoned for horses with a couple of pastures with spigots for water. Ponds at the entrance and kennels at the back of the property with 2 covered concrete slabs (24 x 60 and 24 x 125) with water and lights. So many opportunities with this property. Call today.
Last Agent to Sell the Property
Re/Max Of Albany Brokerage Phone: 2294341600 License #213956 Listed on: 11/05/2021
Last Buyer's Agent
Dominique Watson
Keller Williams Realty Georgia Communities License #412109
| Date | Buyer | Sale Price | Title Company |
|---|---|---|---|
| Linder Edward | $279,900 | -- | |
| Rice Kenneth | $179,000 | -- | |
| George Lowe | $85,000 | -- | |
| Roberson Ethel | -- | -- | |
| Roberson Charlie | -- | -- |
| Date | Status | Borrower | Loan Amount |
|---|---|---|---|
| Open | Linder Edward | $279,900 | |
| Previous Owner | Rice Kenneth | $170,050 |
| Date | Event | Price | List to Sale | Price per Sq Ft | Prior Sale |
|---|---|---|---|---|---|
| 12/14/2021 12/14/21 | Sold | $279,900 | +56.4% | $100 / Sq Ft | |
| 11/05/2021 11/05/21 | Pending | -- | -- | -- | |
| 03/15/2019 03/15/19 | Sold | $179,000 | -- | $73 / Sq Ft | View Prior Sale |
| 02/19/2019 02/19/19 | Pending | -- | -- | -- |
| Year | Tax Paid | Tax Assessment Tax Assessment Total Assessment is a certain percentage of the fair market value that is determined by local assessors to be the total taxable value of land and additions on the property. | Land | Improvement |
|---|---|---|---|---|
| 2024 | $3,889 | $84,160 | $33,320 | $50,840 |
| 2023 | $3,891 | $84,160 | $33,320 | $50,840 |
| 2022 | $3,900 | $84,160 | $33,320 | $50,840 |
| 2021 | $3,358 | $80,280 | $33,320 | $46,960 |
| 2020 | $2,990 | $78,920 | $33,320 | $45,600 |
| 2019 | $3,256 | $75,600 | $33,320 | $42,280 |
| 2018 | $3,264 | $75,600 | $33,320 | $42,280 |
| 2017 | $3,037 | $75,600 | $33,320 | $42,280 |
| 2016 | $3,040 | $75,600 | $33,320 | $42,280 |
| 2015 | $1,369 | $75,600 | $33,320 | $42,280 |
| 2014 | $2,727 | $75,600 | $33,320 | $42,280 |
Seller's Agent in 2021
Karen Richter
Re/Max Of Albany
(229) 854-3730
142 Total Sales
D
Buyer's Agent in 2021
Dominique Watson
Keller Williams Realty Georgia Communities
P
Seller's Agent in 2019
PHOEBE BUSH HATCHER
Trinity Real Estate Broker, Inc
(229) 347-5374
31 Total Sales
Source: Albany Board of REALTORS®
MLS Number: 148864
APN: 00120-00001-08F