Estimated Value: $70,928 - $86,000
3
Beds
1
Bath
1,314
Sq Ft
$60/Sq Ft
Est. Value
About This Home
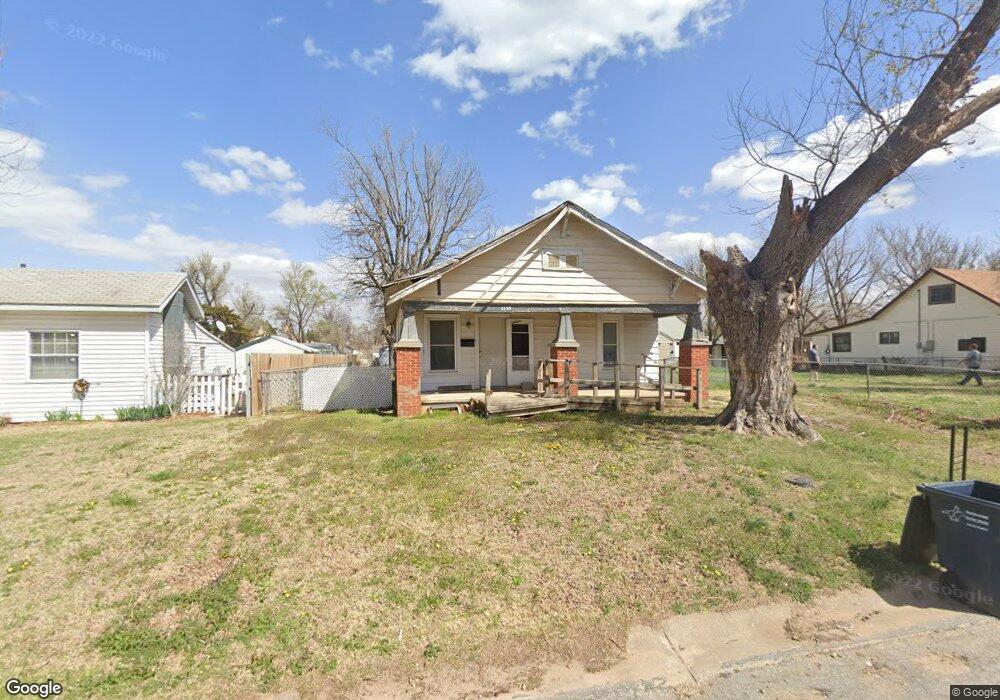
This home is located at 1125 N Adams St, Enid, OK 73701 and is currently estimated at $78,982, approximately $60 per square foot. 1125 N Adams St is a home located in Garfield County with nearby schools including Monroe Elementary School, Emerson Middle School, and Enid High School.
Ownership History
Date
Name
Owned For
Owner Type
Purchase Details
Closed on
Dec 14, 2022
Sold by
Nolen Properties Llc
Bought by
Series Ss Though Series 7Z and Series Aaa Through Series Ooo
Current Estimated Value
Home Financials for this Owner
Home Financials are based on the most recent Mortgage that was taken out on this home.
Original Mortgage
$45,000
Interest Rate
6.02%
Mortgage Type
Construction
Purchase Details
Closed on
Oct 23, 2022
Sold by
Swart Daniel and Swart Rebecca
Bought by
Nolen Properties Llc
Home Financials for this Owner
Home Financials are based on the most recent Mortgage that was taken out on this home.
Original Mortgage
$45,000
Interest Rate
6.02%
Mortgage Type
Construction
Purchase Details
Closed on
Jan 30, 2007
Sold by
Swart Dennis
Bought by
Swart Daniel
Purchase Details
Closed on
Oct 2, 2006
Sold by
Swart Ronald
Bought by
Swart Daniel
Purchase Details
Closed on
Sep 21, 2006
Sold by
Swart Dennis and Swart Adele
Bought by
Swart Daniel
Purchase Details
Closed on
Aug 24, 1978
Create a Home Valuation Report for This Property
The Home Valuation Report is an in-depth analysis detailing your home's value as well as a comparison with similar homes in the area
Home Values in the Area
Average Home Value in this Area
Purchase History
| Date | Buyer | Sale Price | Title Company |
|---|---|---|---|
| Series Ss Though Series 7Z | -- | -- | |
| Nolen Properties Llc | $12,000 | Oklahoma City Abstract & Title | |
| Swart Daniel | -- | -- | |
| Swart Daniel | -- | None Available | |
| Swart Daniel | $2,500 | None Available | |
| -- | -- | -- |
Source: Public Records
Mortgage History
| Date | Status | Borrower | Loan Amount |
|---|---|---|---|
| Previous Owner | Nolen Properties Llc | $45,000 |
Source: Public Records
Tax History Compared to Growth
Tax History
| Year | Tax Paid | Tax Assessment Tax Assessment Total Assessment is a certain percentage of the fair market value that is determined by local assessors to be the total taxable value of land and additions on the property. | Land | Improvement |
|---|---|---|---|---|
| 2024 | $420 | $3,988 | $503 | $3,485 |
| 2023 | $400 | $3,799 | $503 | $3,296 |
| 2022 | $281 | $2,623 | $242 | $2,381 |
| 2021 | $266 | $2,498 | $221 | $2,277 |
| 2020 | $259 | $2,379 | $210 | $2,169 |
| 2019 | $236 | $2,265 | $195 | $2,070 |
| 2018 | $224 | $2,158 | $189 | $1,969 |
| 2017 | $212 | $2,055 | $178 | $1,877 |
| 2016 | $194 | $1,957 | $168 | $1,789 |
| 2015 | $182 | $1,864 | $425 | $1,439 |
| 2014 | $174 | $1,775 | $400 | $1,375 |
Source: Public Records
Map
Nearby Homes
- 406 W Birch Ave
- 501 W Poplar Ave
- 1626 N Washington St
- 1417 N Quincy St
- 114 W Hemlock Ave
- 111 and 111 1/2 W Locust
- 1502 N Quincy St
- 217 E Cedar Ave
- 115 W Vine Ave
- 606 & 608 W Walnut
- 354 E Cedar Ave
- 709 W Cottonwood Ave
- 331 E Walnut Ave
- 2106 N Quincy St
- 1817 Mimosa St
- 2114 N Quincy St
- 8 W Elm Ave
- 10 W Elm Ave
- 12 W Elm Ave
- 15 W Elm Ave
- 1131 N Adams St
- 1121 N Adams St
- 1117 N Adams St
- 1115 N Adams St
- 1126 N Washington St
- 1122 N Washington St
- 1130 N Washington St
- 1118 N Washington St
- 1126 N Adams St
- 1111 N Adams St
- 1128 N Adams St
- 1122 N Adams St
- 1305 N Adams St
- 1120 N Adams St
- 402 W Birch Ave
- 1116 N Adams St
- 1106 N Washington St
- 1309 N Adams St
- 324 W Ash Ave
- 1108 N Adams St